Перейти к основному содержимому

Application Monitoring - Keep Your Finger on the Pulse of Your Systems
· 3 мин. чтения
Evgenii Frolikov
BitDive core team

Application Monitoring

Modern applications are increasingly becoming business-critical. Unstable performance, prolonged downtime, or a lack of visibility into what's happening inside the system can lead to significant financial losses and reputational damage. Meanwhile, traditional logging-based methods of monitoring often fall short: logs may be insufficient, or they get lost in a massive stream of messages.

Microservices Monitoring - Mastering Distributed System Observability

· 4 мин. чтения
Evgenii Frolikov
BitDive core team

Microservices Monitoring

Microservices architecture offers businesses flexibility, independent development teams, and the ability to scale individual services. However, the more complex and distributed a system is, the more pressing it becomes to have centralized monitoring and a clear view of how services interact.

Automatic Exception Logging - A Key to Proactive Application Monitoring

· 4 мин. чтения
Artem Vavilov
BitDive core team

Automatic Exception Logging

The Challenge of Debugging Distributed Applications

Distributed systems have become the backbone of modern software architecture. But with this complexity comes the challenge of tracking down errors and understanding their impact across multiple services. Relying solely on logs or traditional error-tracking tools often leaves developers frustrated, chasing incomplete information.

That’s why BitDive introduces a game-changing solution that combines error interception, distributed tracing, correlation IDs, metrics, and alerts—delivering developers a complete observability toolkit for debugging distributed applications with ease and precision.


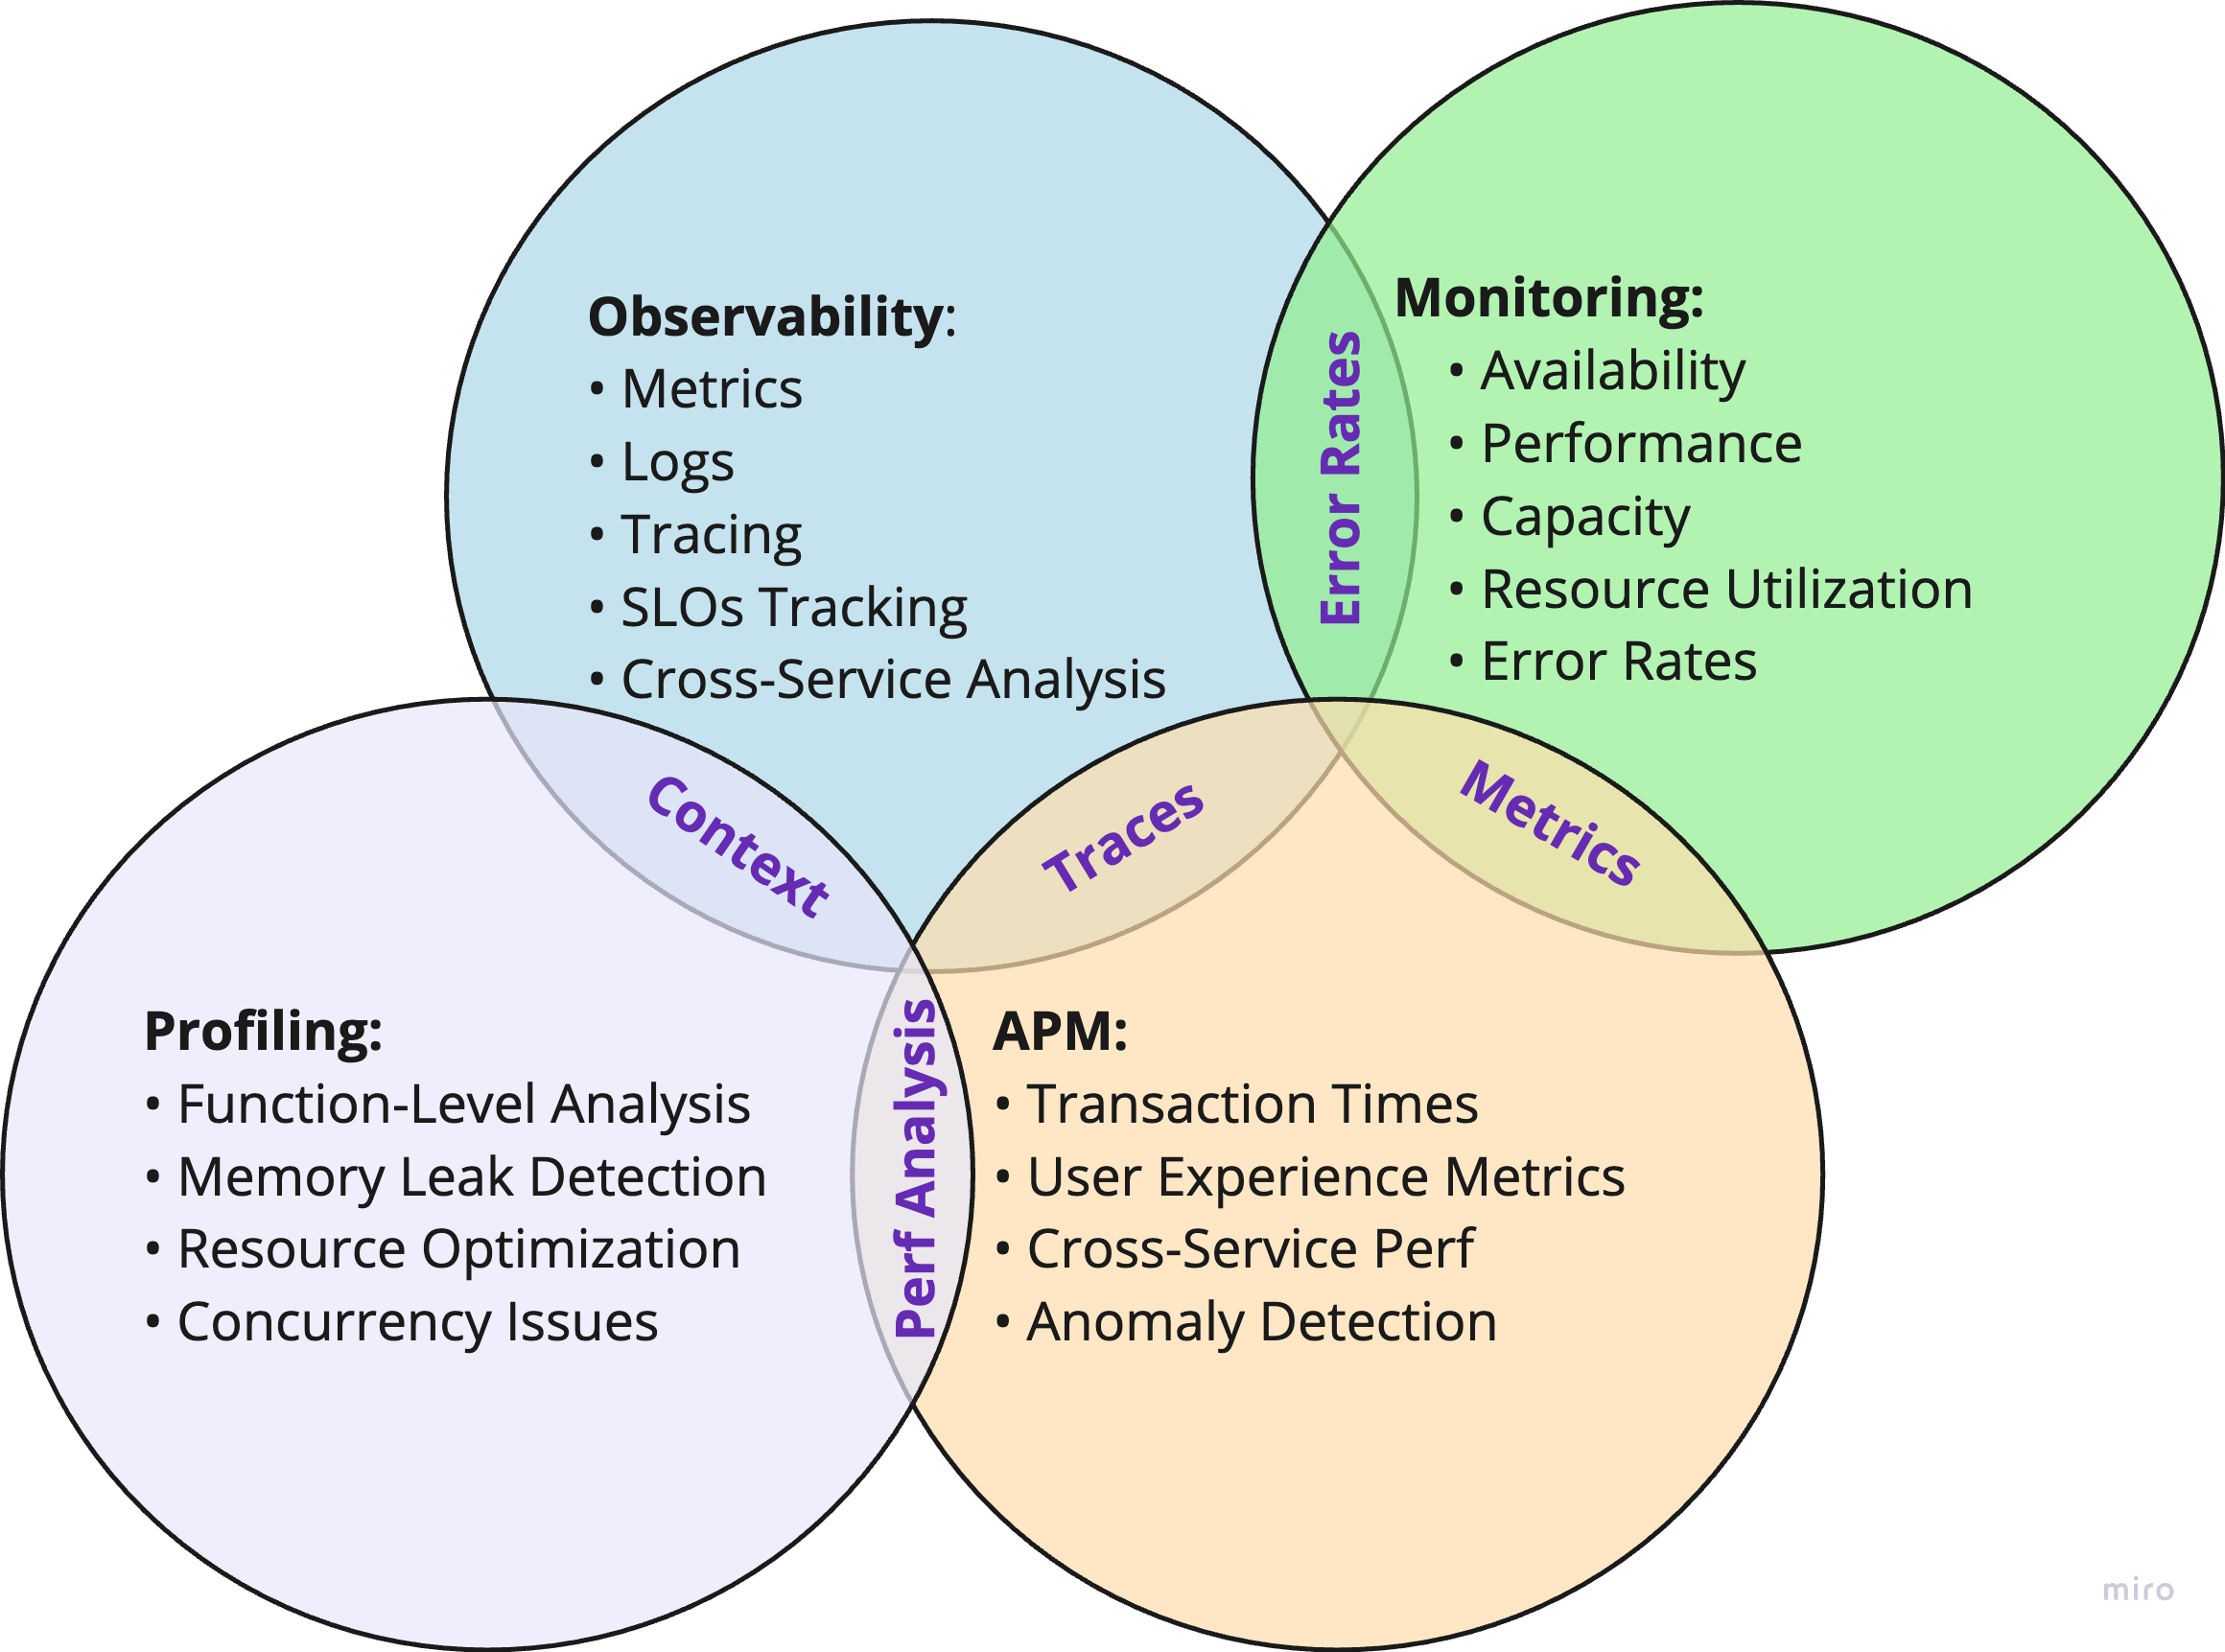
Understanding the Differences: Observability vs. Monitoring vs. APM vs. Profiling

· 3 мин. чтения
Artem Vavilov
BitDive core team

In today's cloud-native environments, maintaining optimal application performance requires multiple complementary approaches. While these tools share some features, they serve distinct purposes in modern performance management.

Venn diagram illustrating the relationships and overlaps between Observability, Monitoring, APM, and Profiling

Application Performance Management (APM)

APM's evolution reflects the changing landscape of application architecture. Originally designed for monolithic applications, modern APM tools now handle the complexities of distributed systems and microservices.

Enhancing Application Performance—Strategies for Optimization

· 12 мин. чтения
Artem Vavilov
BitDive core team

Application Performance Optimization

Imagine your app as a sleek sports car in a high-stakes race. Every millisecond of lag is like a hiccup in the engine, potentially costing you the lead—and in this case, valuable users and revenue. But fear not, digital speed demons! We're about to pop the hood and reveal the secrets of turbocharged app performance. From code optimization tricks that would make a Formula 1 engineer jealous, to scaling strategies that could handle a million users without breaking a sweat—we're covering it all.

Using Flame Graphs to Visualize Method Execution Times in Distributed Systems

· 4 мин. чтения
Artem Vavilov
BitDive core team

At BitDive.io, we leverage flame graphs not for traditional CPU profiling, but for visualizing the time (in milliseconds) that each method in a span consumes. This approach is especially suited for distributed systems with microservices running across different servers and processors. In this post, we will explain why flame graphs are effective for this use case, how they can help uncover bottlenecks in distributed architectures, and why this method could be more suitable for your system’s needs.

Unlocking Performance Bottlenecks with Flame Graphs

· 7 мин. чтения
Artem Vavilov
BitDive core team

Flame Graph

Imagine you're an engineer at a bustling tech company, racing against time to make your app lightning-fast. Your code is a maze, and somewhere in there lurks a sneaky performance bottleneck. Enter flame graphs: the secret weapon of modern software optimization. Born from the brilliant mind of Brendan Gregg, these visual tools have become the go-to for tech giants and startups alike. They're not just graphs; they're x-ray vision for your code, revealing hidden CPU hogs that could be costing your business millions. In a world where milliseconds can make or break user experience (and profits), flame graphs have emerged as the unsung heroes of the enterprise tech world. Curious about how they're transforming the way we build and optimize software? Let's dive in and uncover the fiery truth behind these game-changing tools.