BitDive Quick Start: Deterministic Safety in 2 Minutes
New to BitDive? Start with SaaS
If you're new to BitDive, we recommend starting with our free SaaS version:
- Register for free - Get instant access to BitDive SaaS
- Follow the setup instructions - We'll provide everything you need: credentials, configuration, library setup, and complete onboarding through the dashboard
The SaaS version gives you immediate access to all BitDive features without any infrastructure setup.
On-Premise Deployment Guide
⚠️ Enterprise Deployment: For enterprise on-premise deployments, please request a quote from our pricing page to get started with the appropriate license and support.
This guide covers on-premise deployment for organizations that need to run BitDive in their own infrastructure.
Step 1: Deploy the Backend
Deploy the backend using our bitdive/infrastructure repository (don't forget the final step with Keycloak - see instructions).
For detailed infrastructure deployment instructions, see our Infrastructure Deployment Guide. You can also watch our Infrastructure Deployment Tutorial for step-by-step guidance.
Important: Make sure to complete the Keycloak configuration step after deploying the infrastructure - this is crucial for the BitDive frontend to work properly.
Step 2: Add Your App to BitDive: The 2-Minute Guide
Welcome to BitDive! Getting your application connected is incredibly simple. Just follow these three quick steps, and we'll create everything you need. No coding required, just a little copy and paste!
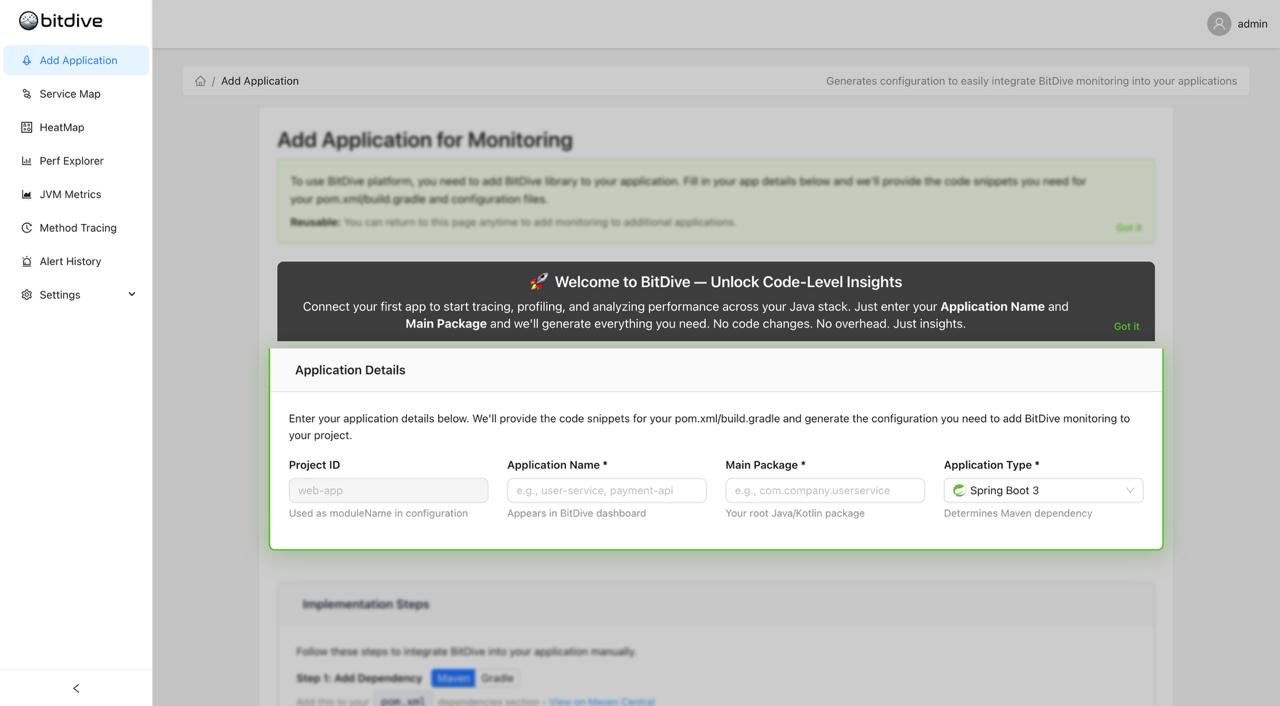
Step 1: Configure Your Application
To set up BitDive for your application, provide these details so we can create the necessary configuration.

Fill in these fields:
- Application Name: What you'd like to call your app in the dashboard
- Main Package: The main package of your Java/Kotlin project (e.g., com.company.app)
- Application Type: Choose your app's framework, like Spring Boot 3
Your Project ID is filled in for you automatically. Easy!
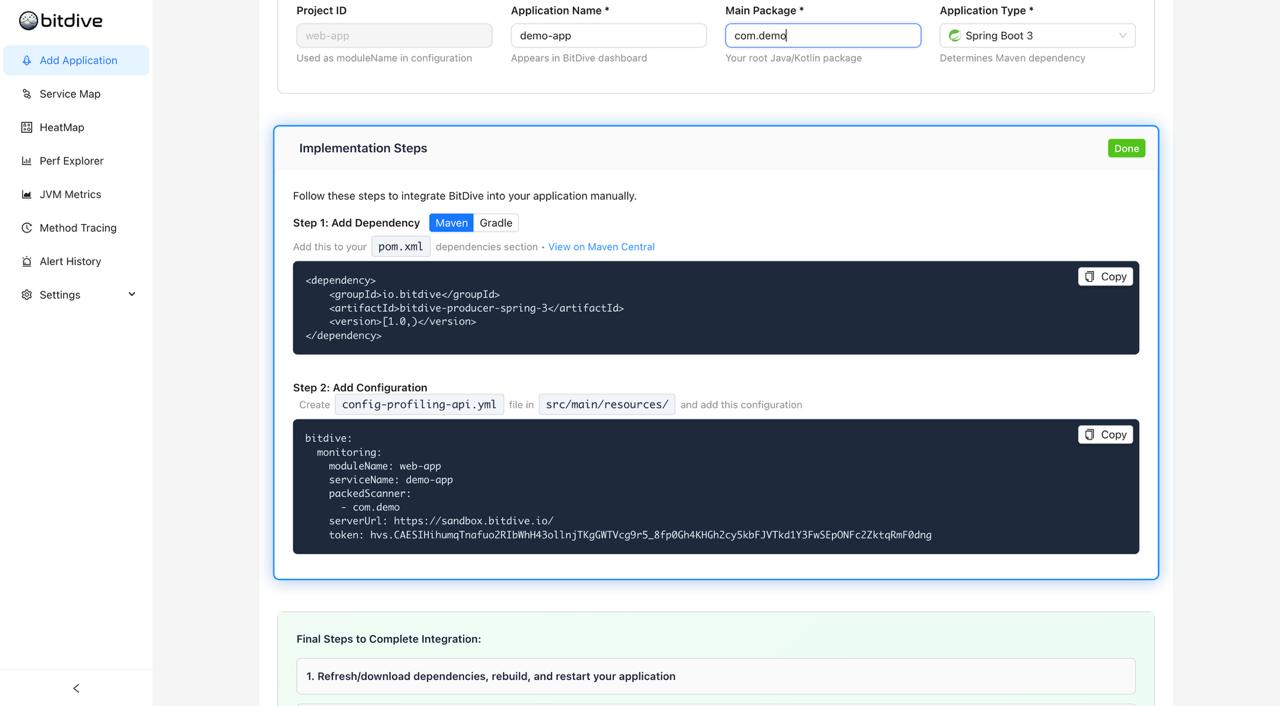
Step 2: Copy & Paste Two Snippets
Now for the magic part. We've generated the exact code you need.

-
Copy the Dependency: Choose Maven or Gradle, then click Copy. Paste this into your project's build file (
pom.xmlorbuild.gradle) -
Copy the Configuration: Click Copy on the second block and paste it into a new file named
config-profiling-api.ymlinside your project'ssrc/main/resources/folder
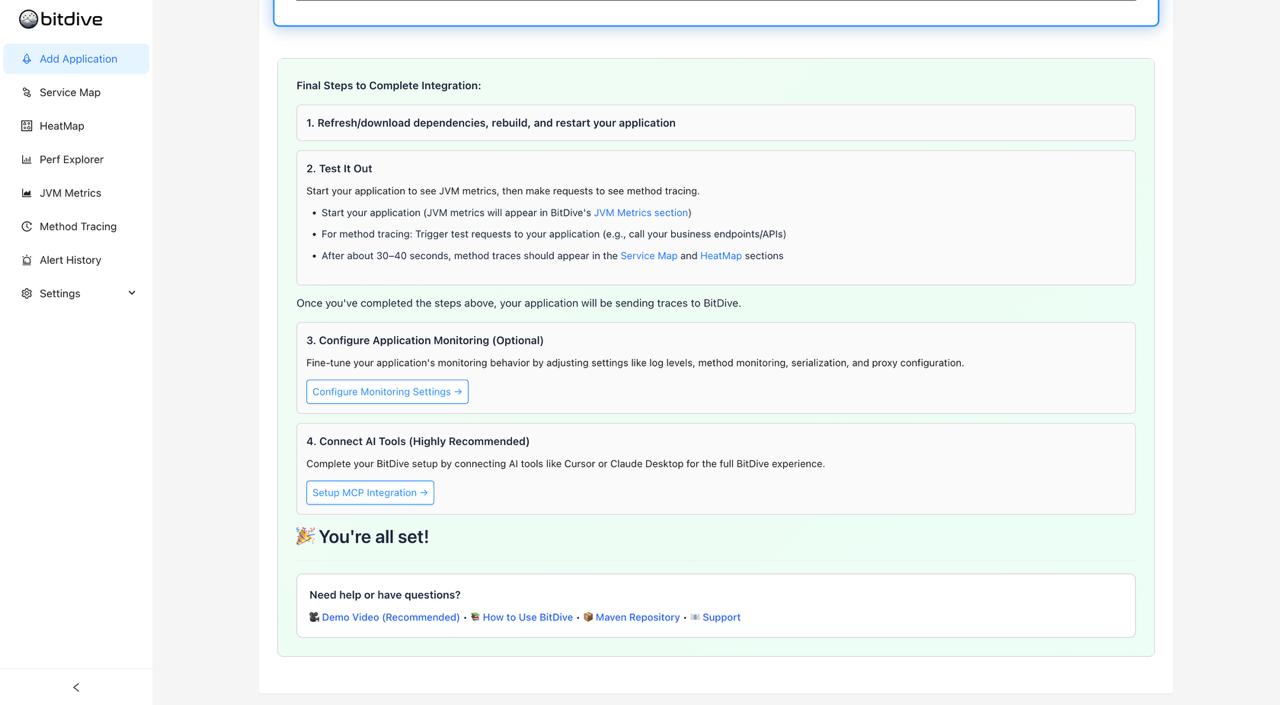
Step 3: Restart & You're Done
That's it! Just rebuild and restart your application.

After a few moments, your app will start sending data to BitDive. You can head over to the JVM Metrics, Service Map, and HeatMap sections to see your application's observability in real-time.
If you get stuck, help is just a click away with the Demo Video and Support links at the bottom of the page.
For additional configuration options and advanced settings, see our Configuration Guide.
For a detailed walkthrough, check out our Application Configuration Tutorial.
AI Integration Prompt - Copy this prompt for Cursor or other AI tools
You can copy the following prompt and give it to AI tools like Cursor to help you implement BitDive integration automatically. Make sure to provide your actual BitDive server URL and credentials when using this prompt.
Please help me integrate BitDive Trace-Driven Testing into my Spring Boot 3 application.

1. Add the BitDive dependency to pom.xml/build.gradle.
2. Create config-profiling.yml for runtime recording.
3. Help me "Close the Loop" by setting up the MCP server context so you can see my execution traces and self-verify your code changes against runtime context and before/after trace comparison.

Credentials and URL: [INSERT_YOUR_SERVER_DETAILS]
Main Package: [INSERT_PACKAGE]
Step 3: Test It Out
After implementation, you should be able to start your application, make test requests, and see traces in the BitDive interface after 30-40 seconds.
- Start your application
- Trigger a test request to your application (e.g., call any endpoint/URL)
- After about 30–40 seconds, the trace should appear in the BitDive interface at
https://your-server-ip. These traces become the baseline runtime evidence for creating Unit Tests, Integration Tests, and before/after verification.
AI Help for Testing - Copy this prompt to get AI assistance with testing your integration
You can copy the following prompt and give it to AI tools like Cursor to help you create test commands for BitDive integration. Note that AI doesn't always work correctly - this is mostly for example. You can also use your favorite tools like Postman to make simple requests, use your application's UI, or run existing tests.
Please help me test my BitDive integration by creating simple curl requests to my existing application endpoints. Here's what I need:

1. Identify 1-2 existing user-facing endpoints in my application (like /api/users, /products, /orders, or any business logic endpoint)

2. Create simple curl commands to test these endpoints:

   For Linux/Mac/WSL:
   curl -X GET http://localhost:8080/api/users
   curl -X GET http://localhost:8080/api/products

   For Windows PowerShell:
   Invoke-WebRequest -Uri http://localhost:8080/api/users -Method GET
   Invoke-WebRequest -Uri http://localhost:8080/api/products -Method GET

   Or use curl.exe directly in PowerShell:
   curl.exe -X GET http://localhost:8080/api/users
   curl.exe -X GET http://localhost:8080/api/products

3. After running these curl requests, I should be able to see traces in my BitDive interface at my server URL within 30-40 seconds.

Please just provide the curl commands - no need to create or modify any application code.
MCP Setup
Connect your AI tools (like Cursor and Claude) directly to BitDive for powerful AI-driven performance analysis. This allows your AI assistant to access live performance data and provide intelligent insights.
For complete setup instructions, see our MCP Integration Guide - setup is just a few copy-paste steps.
Need Help?
Both steps are covered in our detailed docs, with video instructions included. Check the links above for more comprehensive guides.
If you need assistance or have questions, please contact us at: welcome@bitdive.io