Distributed Tracing for Java Microservices
- Depth: Moves beyond service-to-service spans into method-level code visibility.
- Service Map: Live interactive visualization of microservices, DBs, and message queues.
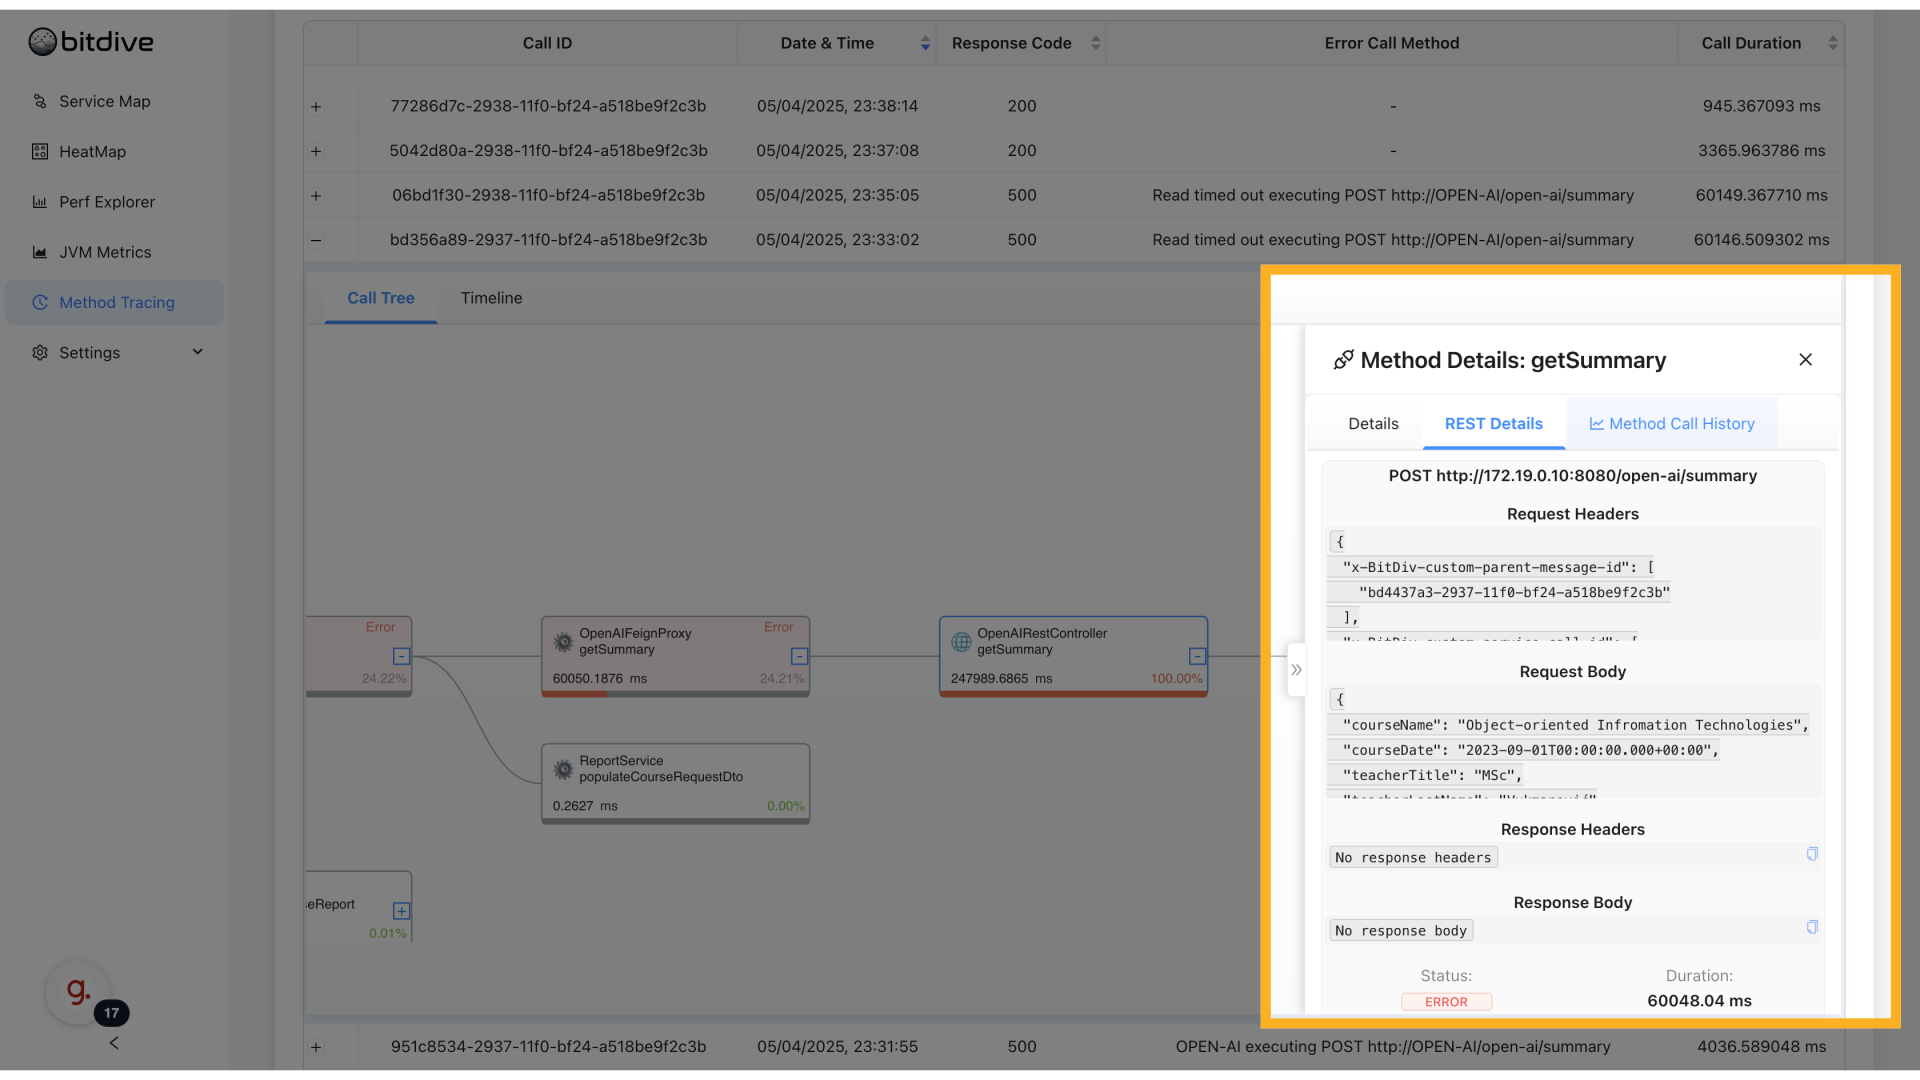
- White-Box Insight: Inspect SQL, HTTP payloads, and call hierarchies inside every service.
- Verification: Provides the ground truth needed for before-and-after trace comparison.
Tracing requests in distributed systems is no longer optional.
When an application is made of dozens or hundreds of microservices, the question "what happened to this request?" becomes one of the most difficult problems in production.
Traditional distributed tracing solutions often stop at service-to-service spans and metadata:
- Service A called Service B.
- Service B called Service C.
- Request took 1200ms total.
But this leaves critical questions unanswered. What happened inside Service B? Which part of the logic caused delay or failure? Was it a REST call? SQL query? An exception?
BitDive takes distributed tracing deeper, combining service-level traceability with method-level observability and providing the runtime evidence used for deterministic verification.
Related Guide Interactive Service Map for Microservices
Understanding Service Chains
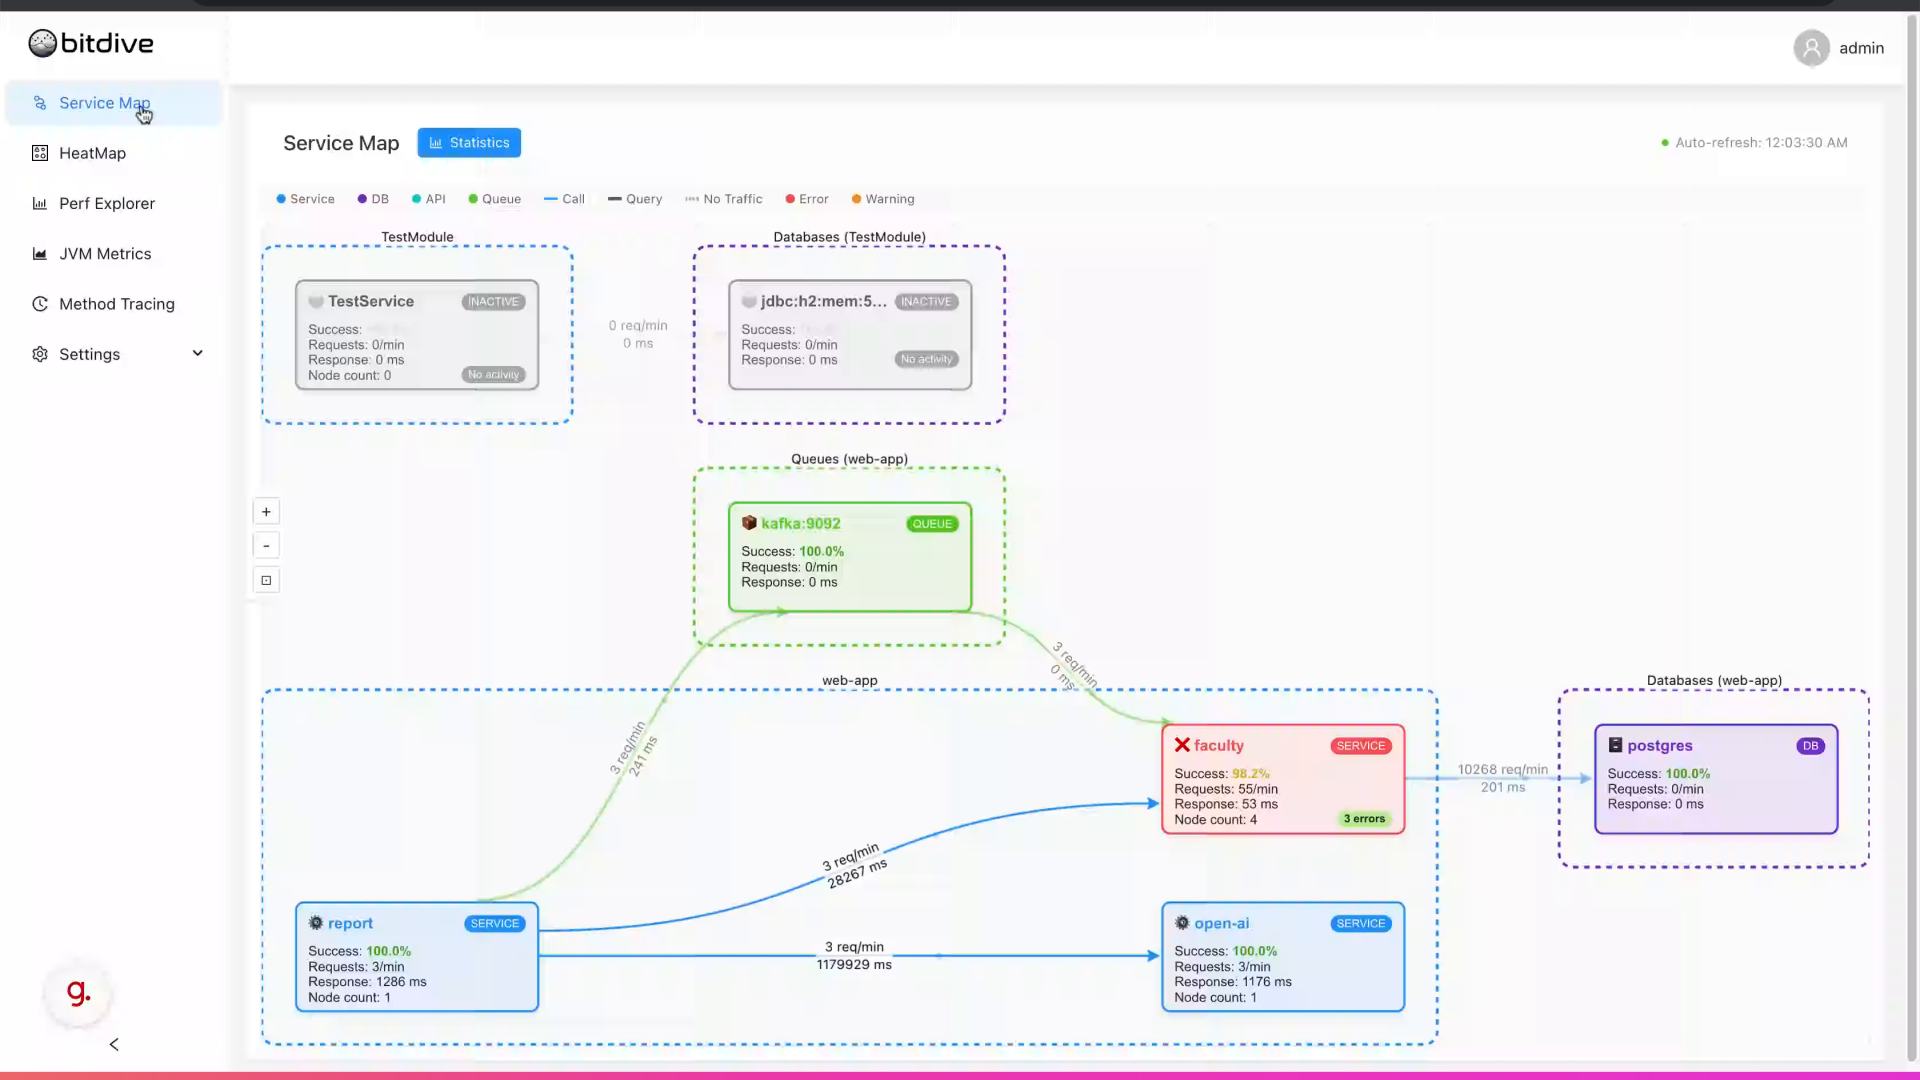
BitDive begins tracing at the highest level - services. The Service Map provides a live, interactive view of how microservices, databases, queues, and APIs connect and interact.
Each line represents real traffic and each node shows performance indicators: success rates, request volumes, errors, and response times.
This is where tracing starts. A user request moves from service to service, and each connection is captured.
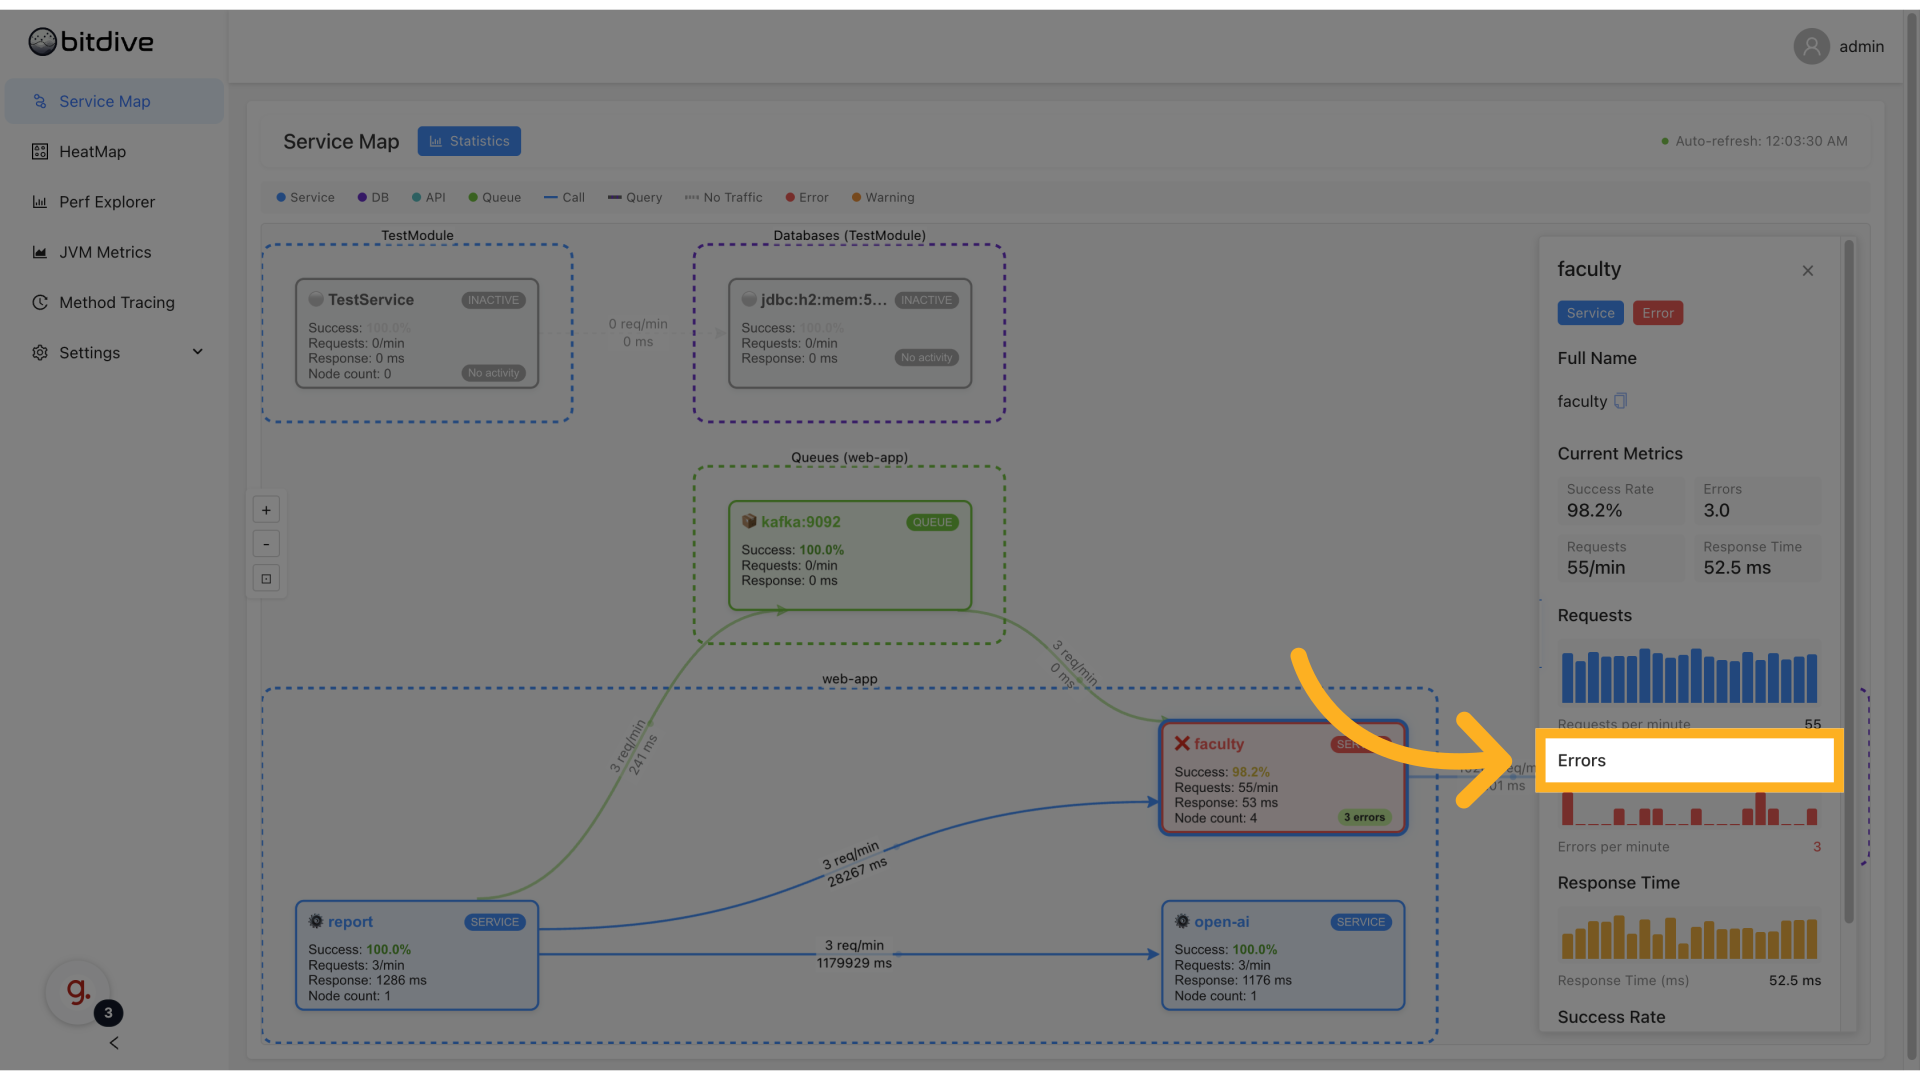
In this view, it is easy to see which services are the bottlenecks, which are failing, and where requests slow down. However, this is still only the start of the tracing journey.
Diving into Method Chains
When service-level tracing is not enough, BitDive allows engineers to continue following the request deeper.
By selecting any service or using HeatMap and Performance Explorer, one can move directly into Method Tracing - a view that visualizes exactly what happened inside the service.
This is where BitDive's approach to distributed tracing becomes truly unique.
Instead of opaque spans or low-level function calls, it shows readable, code-level information:
- The method names, classes, and packages involved.
- The exact parameters passed.
- Return values or exceptions.
- The full nested call chain inside the service.
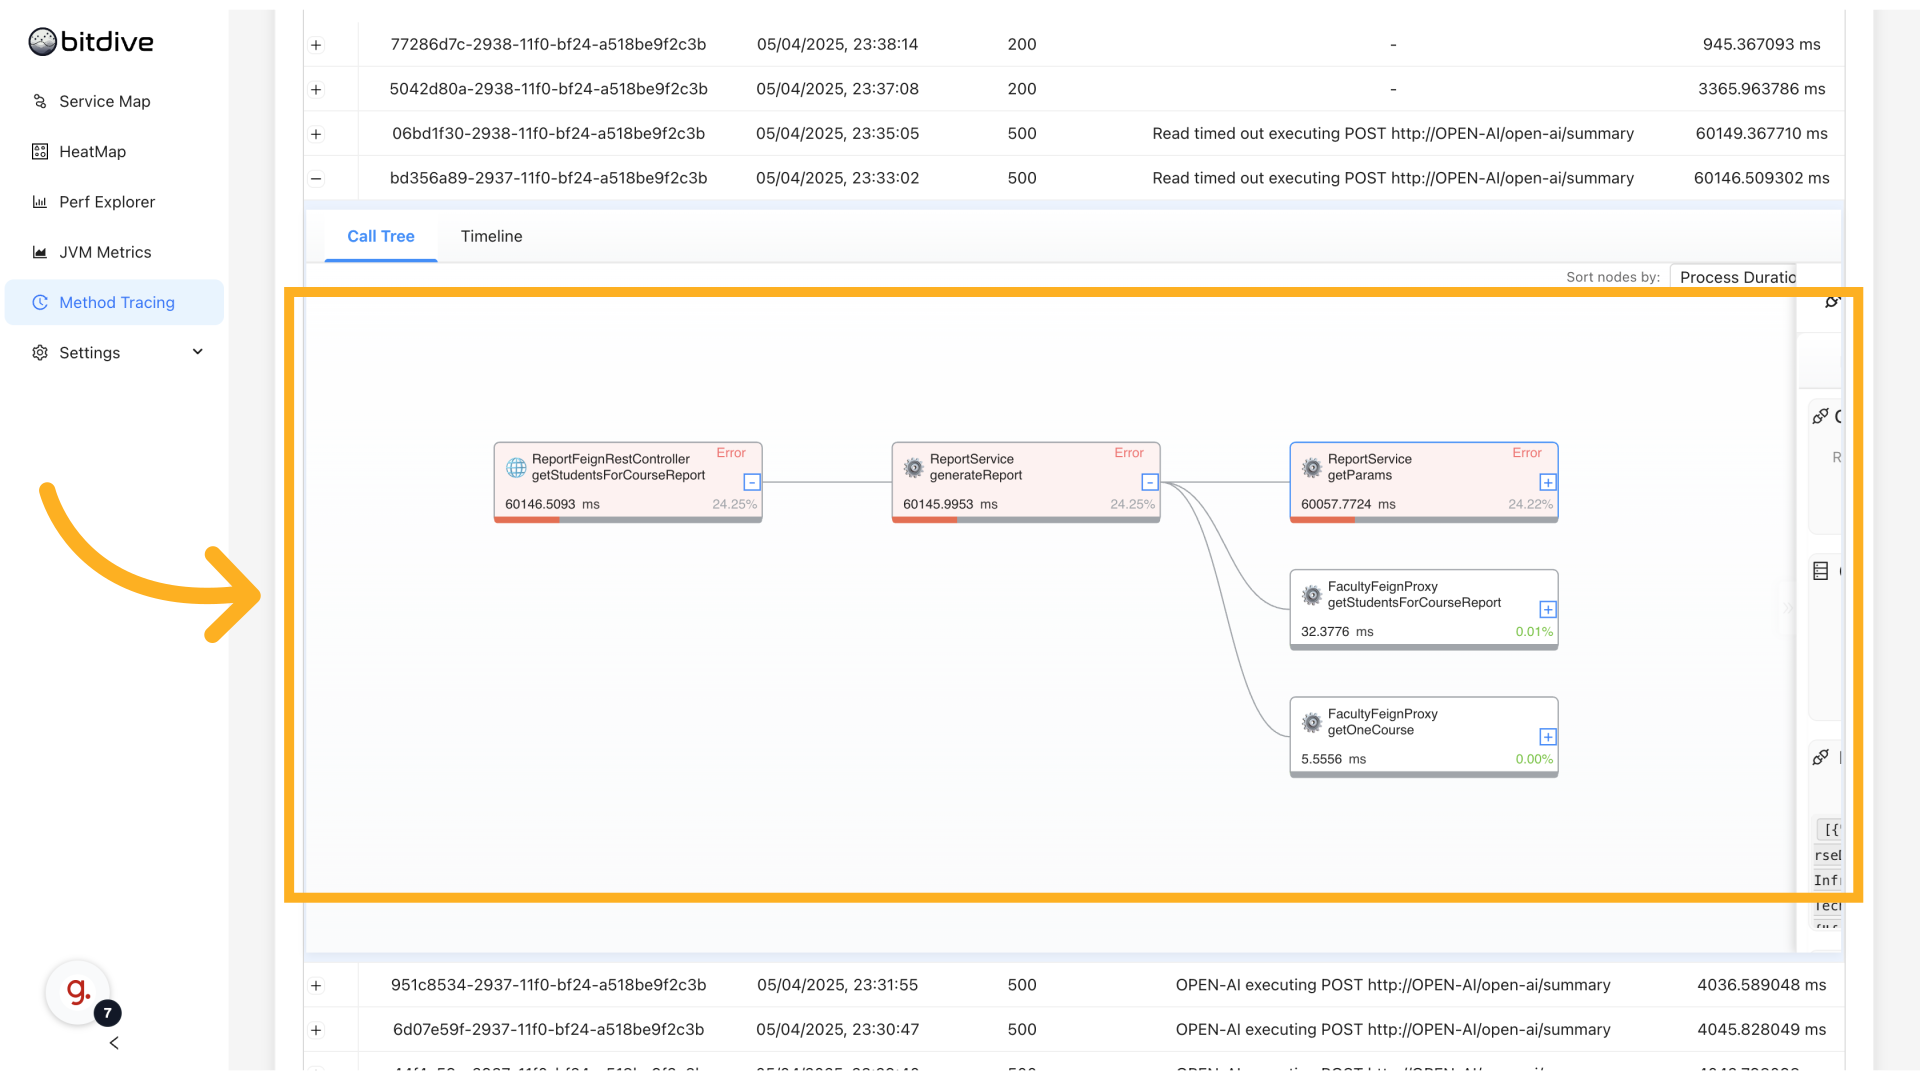
As the request moves through the service's logic, every method it touches is recorded and displayed. Slow methods are visible immediately. Failures are clearly marked and easy to drill into.
If the request leaves the service again - calling another microservice, API, database, or queue - BitDive continues following.
Seeing Cross-Service Call Chains
What makes BitDive powerful is that these method traces do not stop at the service boundary. When one service calls another, the trace continues.
BitDive visualizes this in the same method call chain. You can see:
- Where the service call originated (method and parameters).
- Which service was called.
- What happened inside that next service, method-by-method.
This creates a true distributed method-level trace. From the user's first HTTP request to the very last SQL query or cache lookup, BitDive captures every step.
Distributed Observability Case Study Distributed Flame Graphs: Visualizing Method Execution in Modern Microservices
Troubleshooting and Optimization
BitDive's distributed tracing is not just about seeing what happened. It is about helping teams solve problems faster.
When a request fails or slows down, it takes only seconds to find:
- Where in the service chain the failure occurred.
- Which method introduced the slowdown.
- What external dependency (REST, SQL, Queue) caused latency.
- Which parameters triggered unusual behavior.
For example, when a timeout happens deep inside a multi-service chain, BitDive makes it easy to locate the exact method and request that led to the problem - eliminating guesswork and speeding up root cause analysis.
Summary
BitDive redefines distributed tracing by combining service interaction graphs with method-level execution chains. These traces serve as the foundation for creating unit tests and providing runtime context to AI agents.
Because traces capture full HTTP exchange details (endpoint, headers, serialized request/response body, status codes), they also enable inter-service API regression detection. After a code change, comparing before/after traces reveals payload drift, missing headers, altered error responses, and changed call sequences, catching regressions that static contracts and unit tests miss.
You can start at the top with the Service Map to see how your services interact and where bottlenecks are. You can continue by diving into Method Tracing to follow the request through methods, across services, into external dependencies and back.
And you can do all of this with full context:
- Service → Method → External call → Response → Error (if any)
This end-to-end visibility helps engineering teams not only detect issues but understand them. In modern distributed systems, that is exactly what tracing should provide.