Observability & Code Profiling
for Distributed Systems
Uncover Hidden Bottlenecks with Minimal Overhead
BitDive delivers real-time code-level observability for Java-based distributed systems, enabling instant root cause analysis and performance optimization through continuous low-overhead profiling.
Ideal for developers, and performance-focused enterprises.
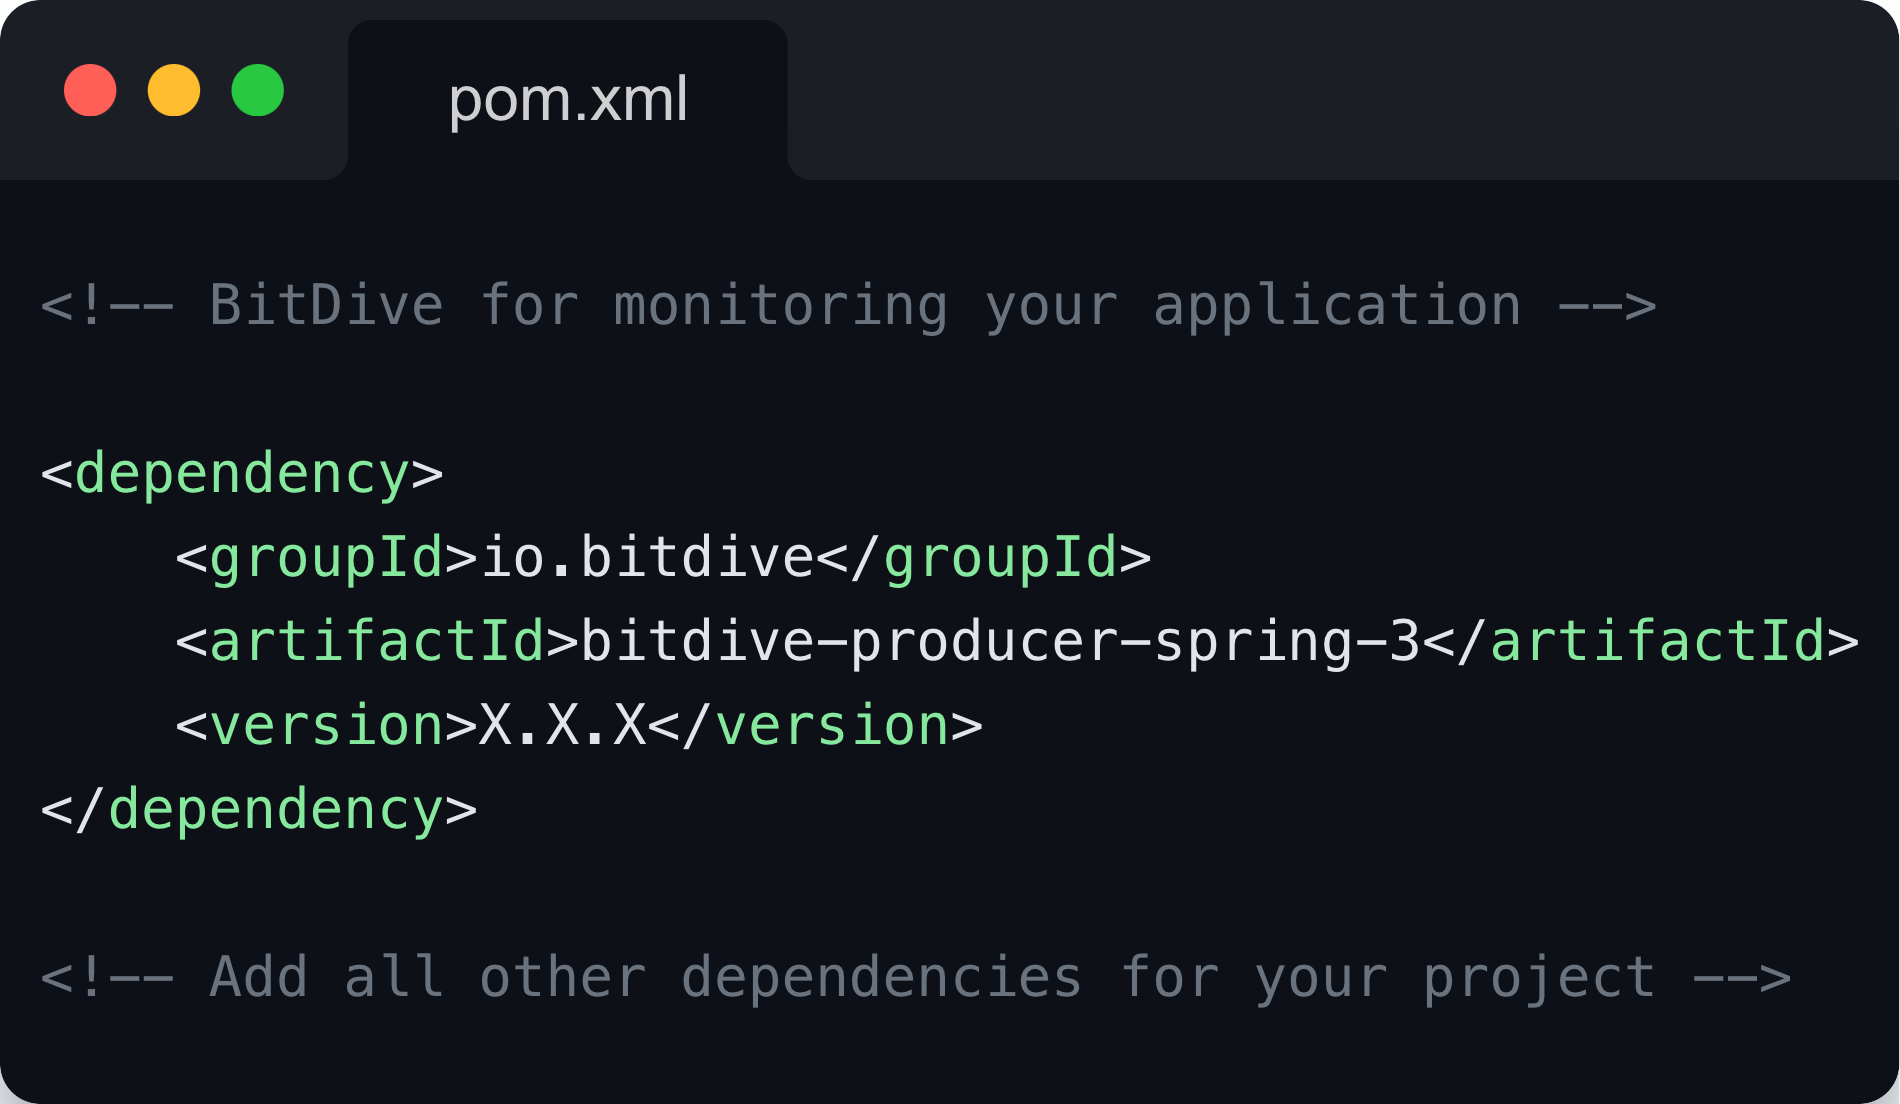
All-in-One, Developer-Friendly Integration
- Effortless Setup: Deploy the entire infrastructure in minutes using our Docker Compose configuration
- Plug-and-Play Library: Simply add the BitDive Maven dependency to your pom.xml file to start profiling
- No Code Changes: Auto-instrumentation eliminates the need to modify your application code
- Zero Hassle: Forget assembling complex, puzzle-like solutions—everything you need is included and optimized
- Seamless in CI/CD: Ideal for containerized environments and DevOps workflows
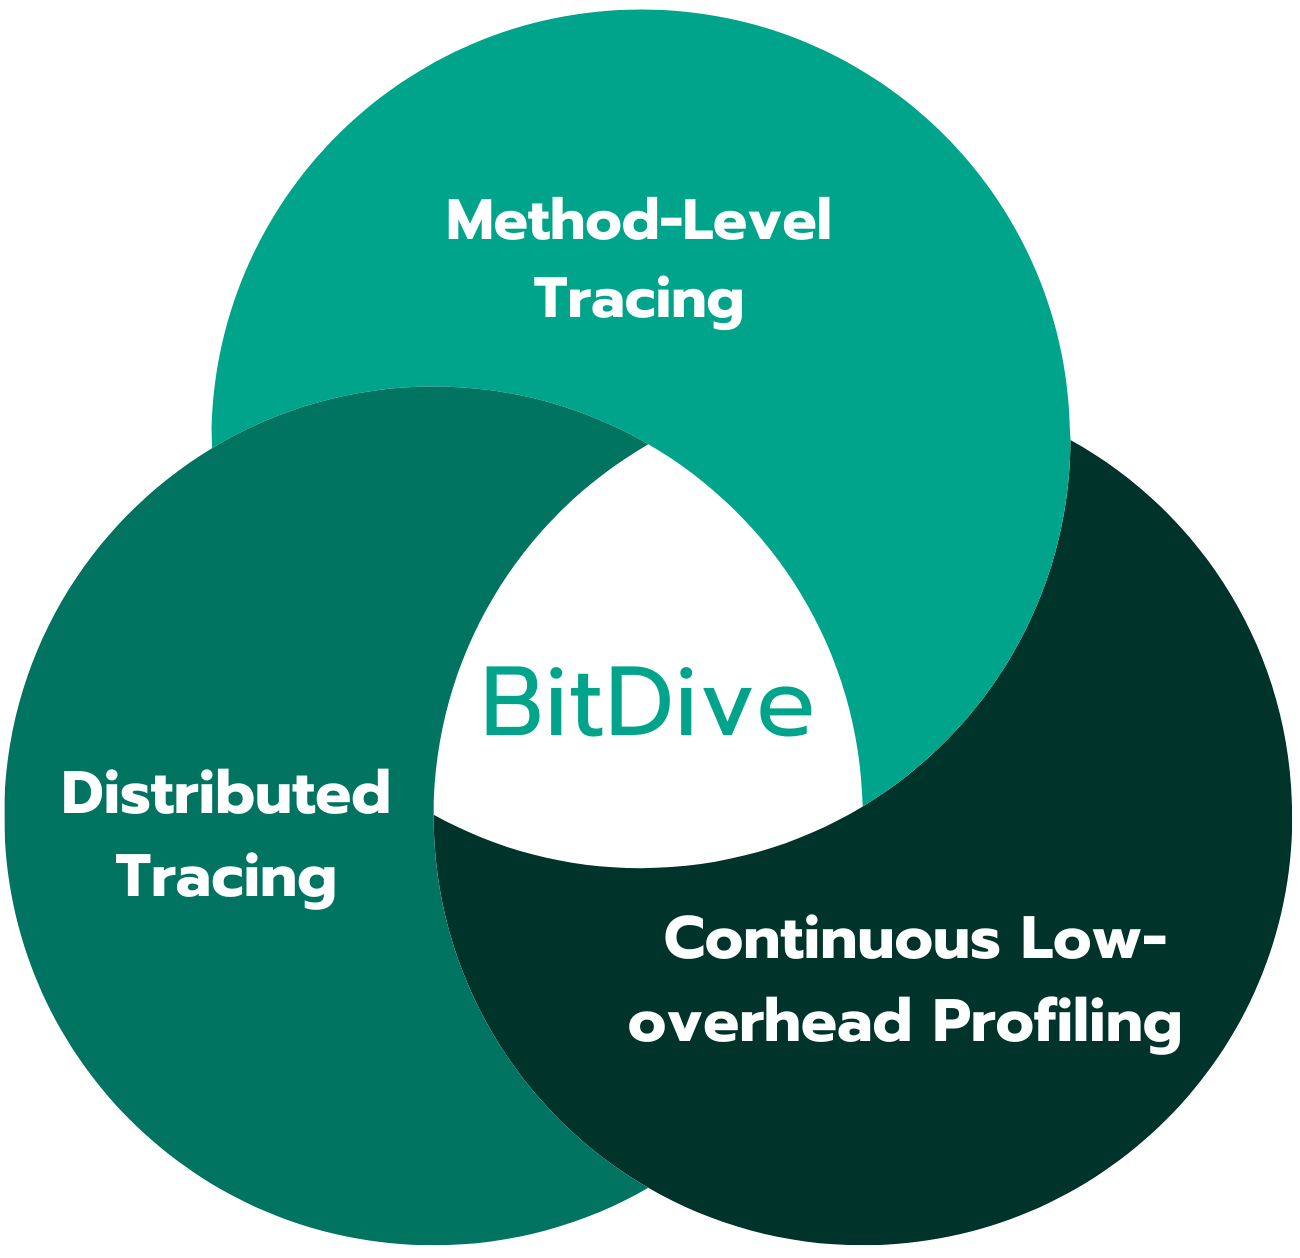
BitDive Core Capabilities
- Runs seamlessly in production, gathering method-level data
- Low (very low) overhead due to in-process monitoring
- Captures method parameters, SQL queries, and errors
- Profiles asynchronous tasks and multithreaded operations
- Enables root cause analysis with full context data
- Monitors large-scale distributed systems in production
- Works with any Java code, not just common frameworks
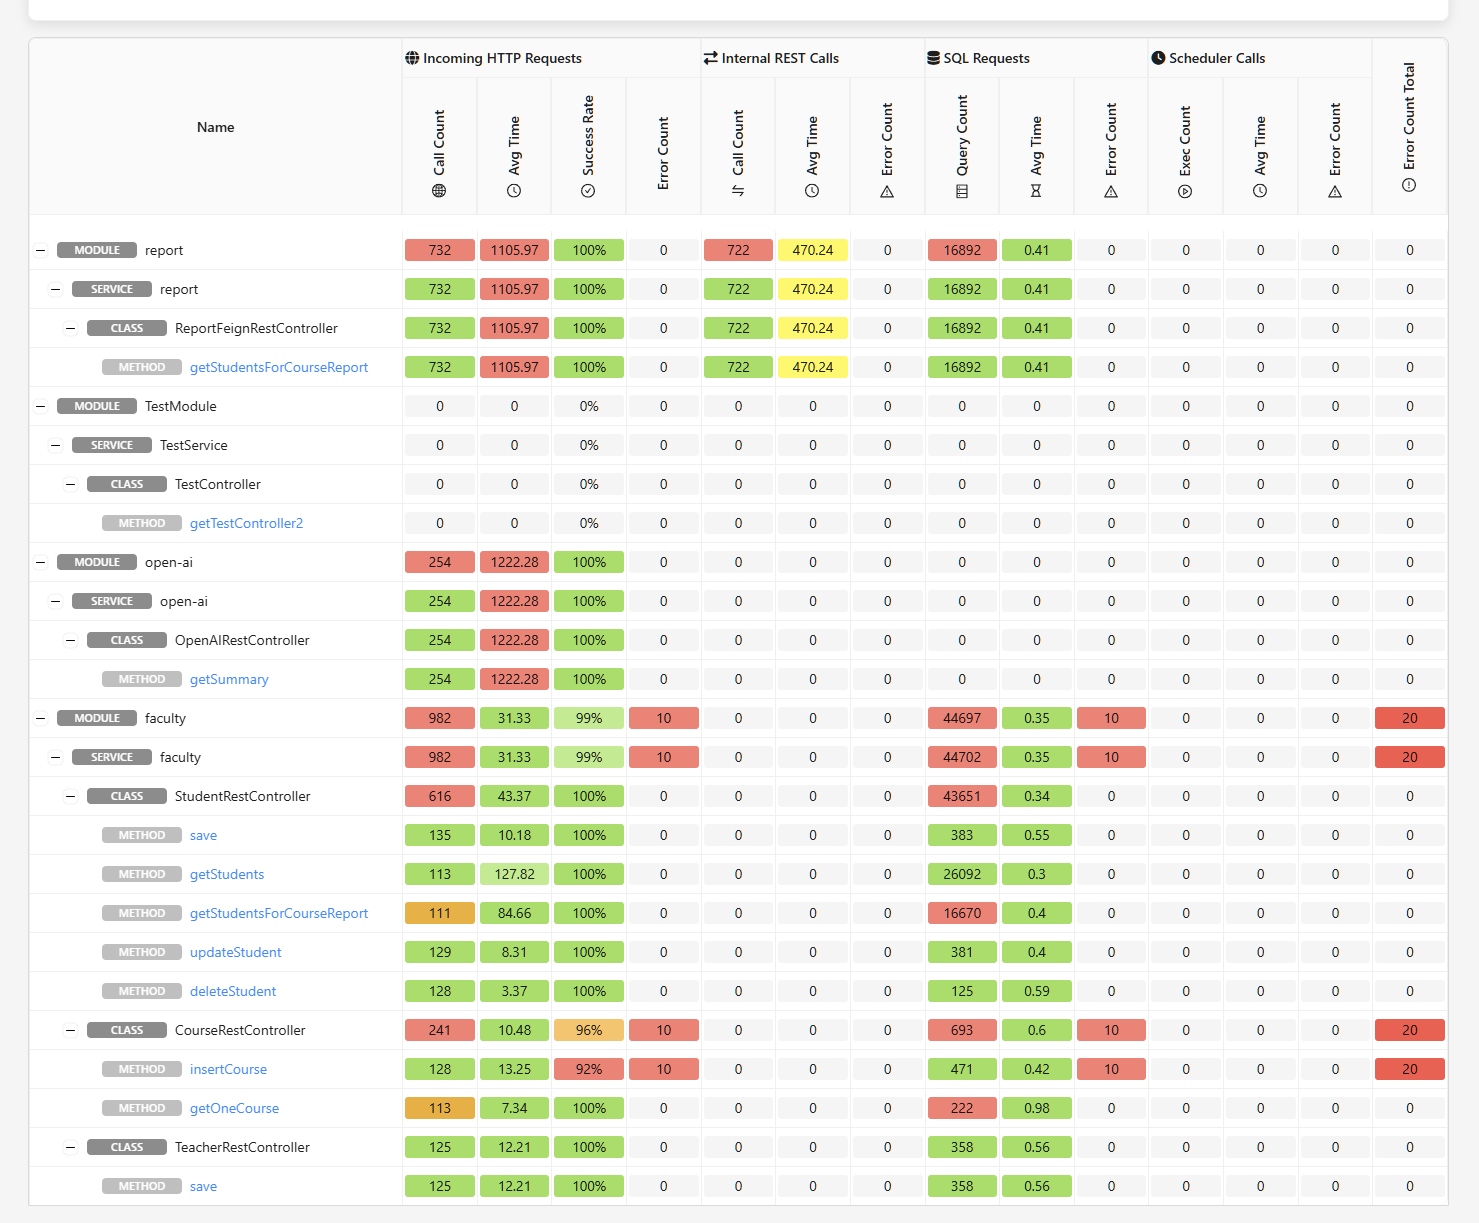
Real-Time Performance Heatmap & Observability
- Color-coded heatmap showing system response times and changes
- Real-time tracking of HTTP, REST, SQL and scheduler metrics
- Module-to-method drill-down with response time details
- Success rate monitoring with comprehensive error tracking
- SQL performance analysis with query execution counts
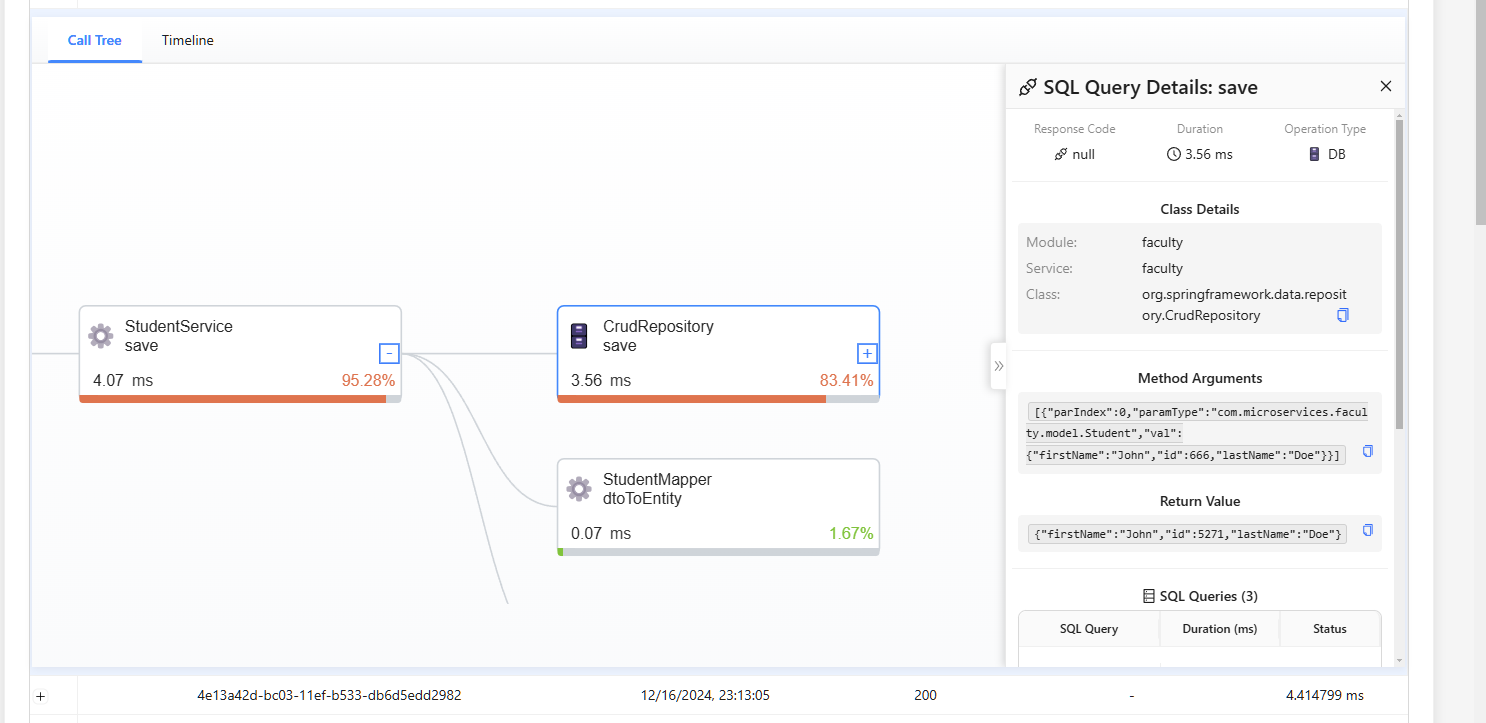
Code-Level Call Tree & Parameter Analyzer
- Debug production issues by tracing complete method call sequences
- Access full method context including params and return values
- Validate data transformations across microservices
- Track request and response data between service boundaries
- Identify performance bottlenecks with visual execution path analysis
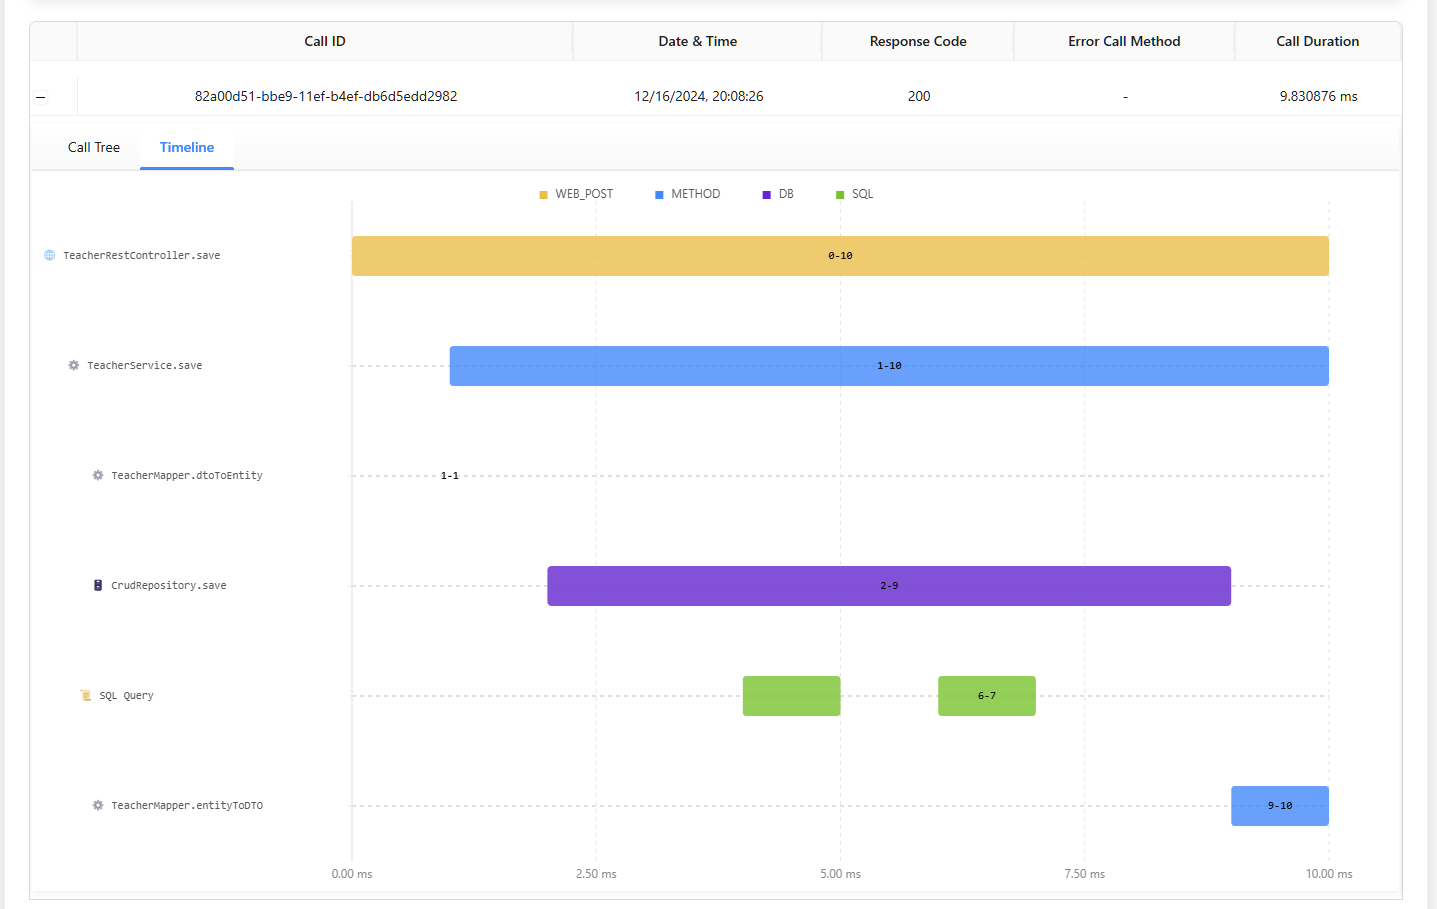
Service Call Timeline Analyzer
- Track method execution timeline with precise timing visualizations
- Distinguish web calls, internal methods, database and SQL operations
- Pinpoint blocking operations and execution overlaps
- Measure database query performance with detailed timing data
- Identify service latency and communication bottlenecks
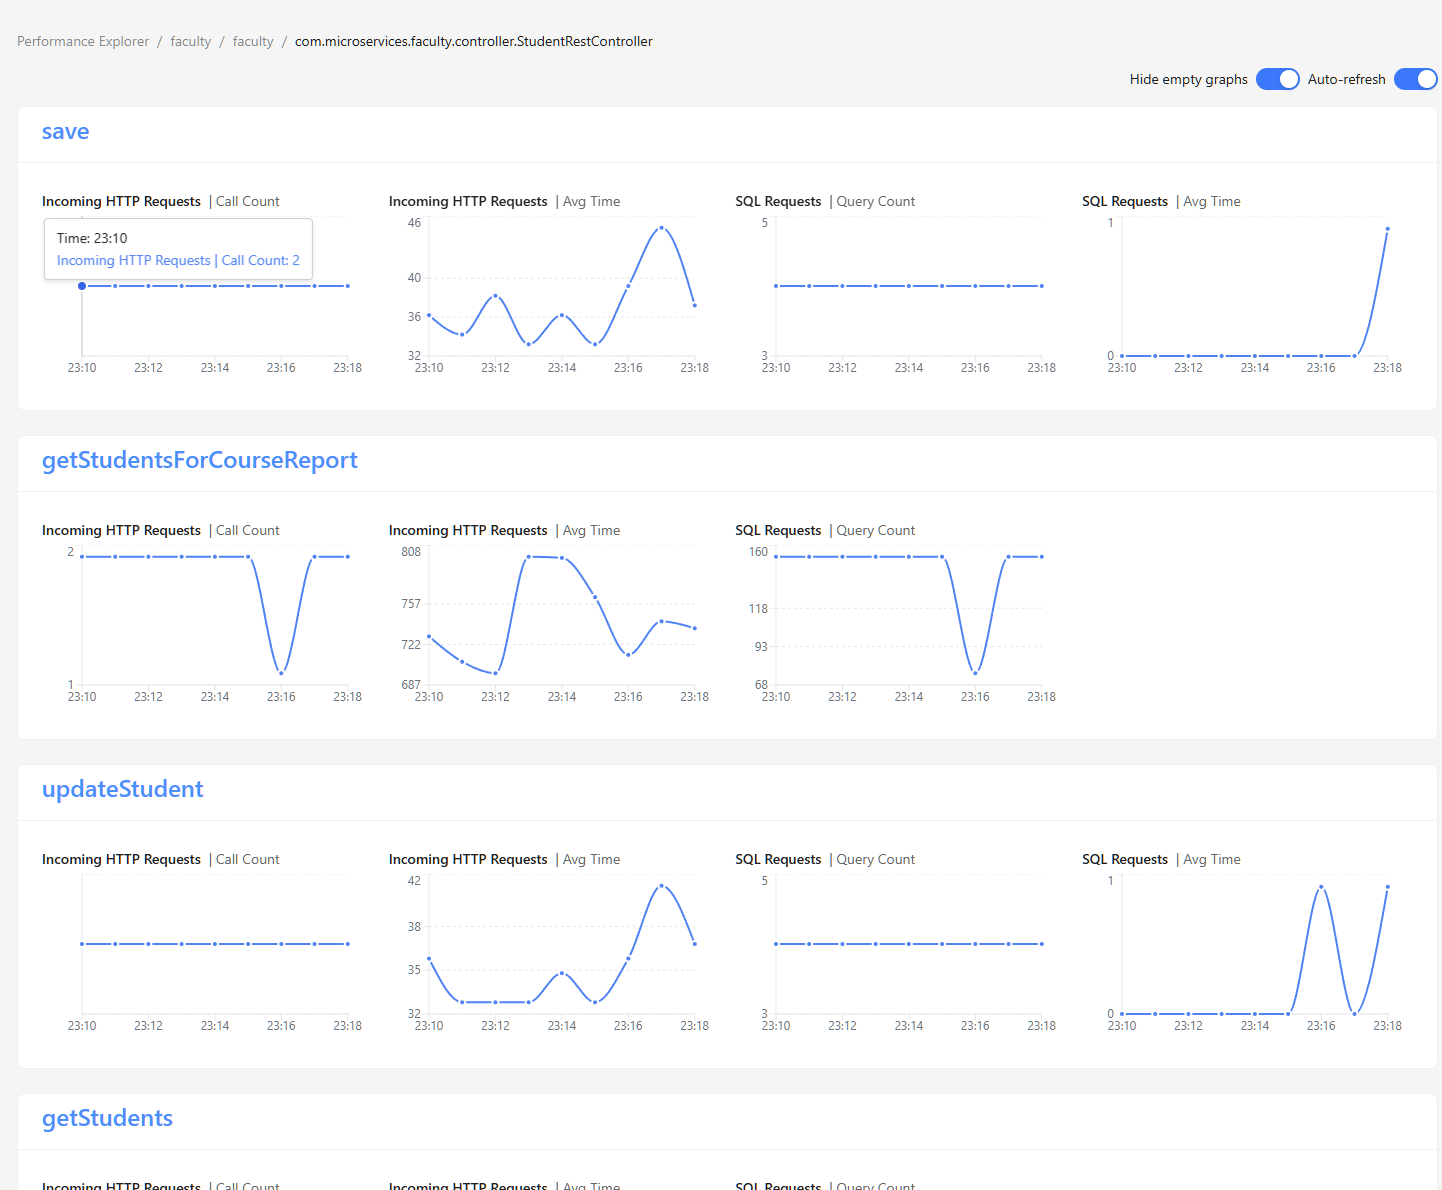
Method-Level Performance Graphs & Metrics
- Monitor HTTP requests, methods and SQL queries in real-time metrics
- Track service response times through interactive time-series graphs
- Compare call counts and query volumes across different operations
- Identify performance trends with auto-refreshing data points
- Analyze SQL timing patterns with precise time-based visualizations
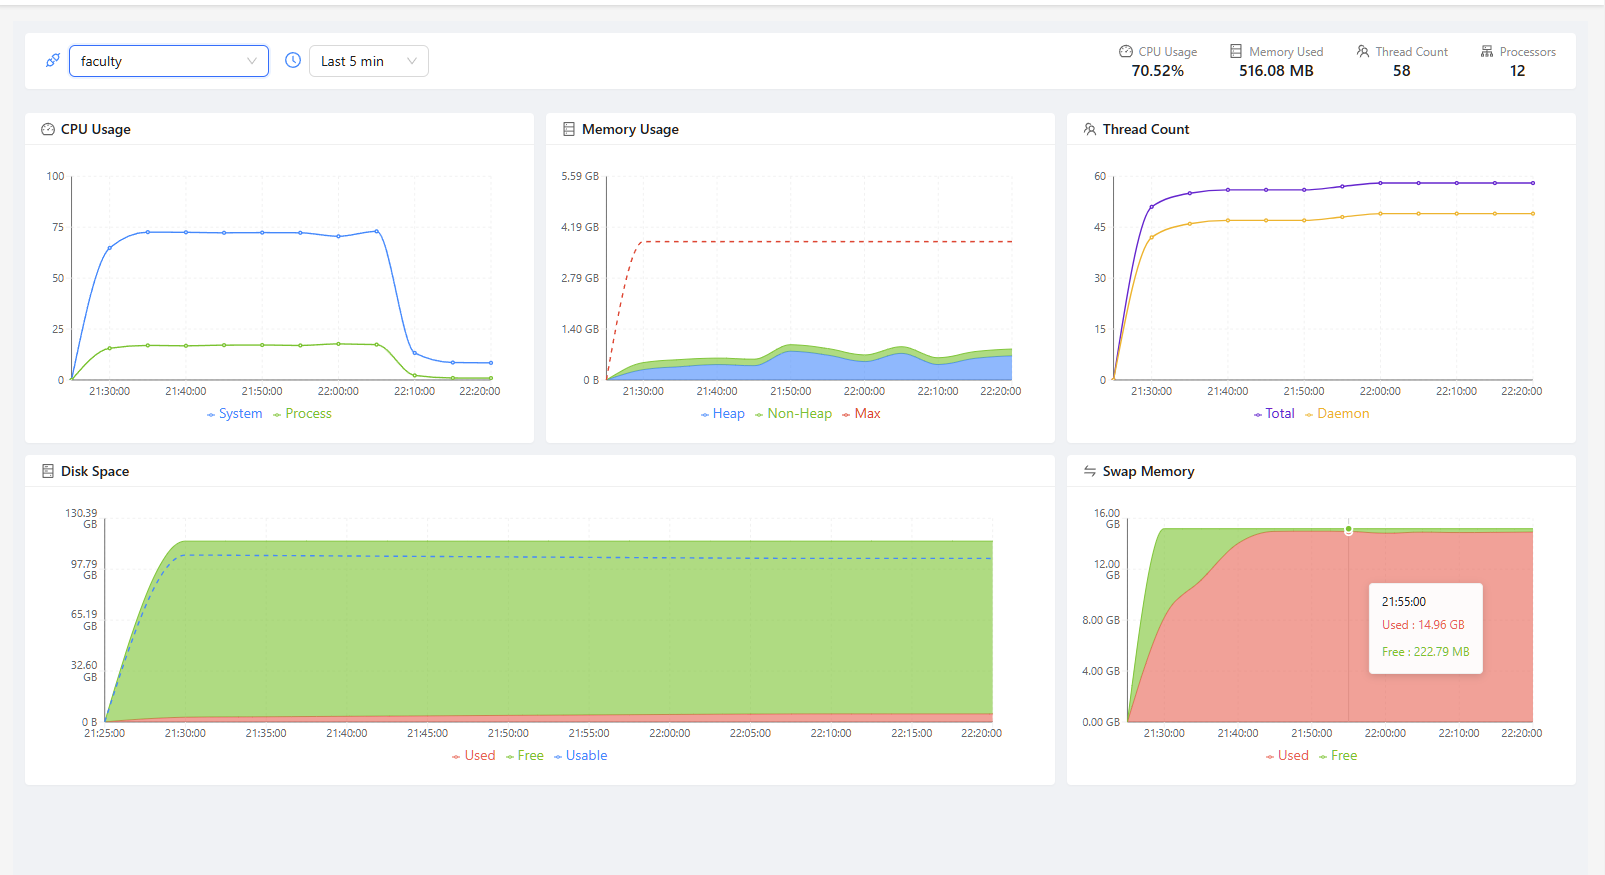
Real-Time JVM Resource Monitor
- Comprehensive system metrics tracking CPU, memory, and thread utilization
- Live heap and non-heap memory analysis with maximum threshold monitoring
- Thread management insights showing daemon and total thread patterns
- Disk space allocation with used vs free space visualization
- Swap memory tracking for system memory pressure detection

Easy Friday Deploy to Production
- Full deployment visibility from service topology to method-level details
- Compare before/after behavior instantly and asses new release performance
- Get full contextual data with method parameters, SQL queries, and errors
- Enables root cause analysis with full context data input/output values
- Monitors large-scale distributed systems in production without overhead
How BitDive Delivers ROI
Faster Troubleshooting
Reduce MTTR by up to 70% with precise method-level tracing and automatic bottleneck detection, enabling rapid issue resolution
Improved User Experience
Detect and prevent performance degradation before users are impacted by monitoring method-level metrics continuously
Resource Optimization
Save on cloud infrastructure costs by identifying performance bottlenecks and optimizing resource utilization across services
Enterprise-Grade Scalability
Whether you’re managing monolithic applications or microservices, BitDive scales effortlessly, from single apps to complex microservices architectures
Five-Minute Setup
Start profiling with one Maven dependency and minimal YAML config - no code changes, no JVM agents required
Reduced Operational Costs
Cut support tickets and performance-related incidents through proactive monitoring and rapid root cause analysis
How BitDive Stands Out
Beyond traditional profiling

Most APM and profiling tools force you to make difficult tradeoffs: either collect high-level metrics that miss critical details, or get comprehensive data that impacts performance.
BitDive solves this through an efficient library-based approach that captures complete method-level data—including parameters, return values, SQL queries, and async operations—while maintaining microsecond-level overhead.
This lets you run continuous profiling in production and trace requests end-to-end across distributed services, finally making distributed debugging and performance optimization practical at scale.
Built for Modern Java Teams
Modern Profiling for Cloud-Native Era
Cloud-Native Applications
Trace requests across Kubernetes clusters and cloud services while maintaining low overhead in containerized environments.
High-Load Production
Run continuous profiling in high-throughput systems without performance impact. Catch issues early and optimize resource usage.
Microservices Architecture
Follow requests through your entire service mesh with method-level visibility. Understand distributed system behavior in production.
CI/CD Integration
Detect performance regressions early through automated deployment pipeline integration. Compare method-level metrics between releases.