Understanding BitDive Daily Statistics
The Daily Statistics page provides a consolidated overview of performance bottlenecks and error sources for the current day. It helps developers detect slow queries, heavy methods, problematic requests, and recurring errors - all in one place.
Overview
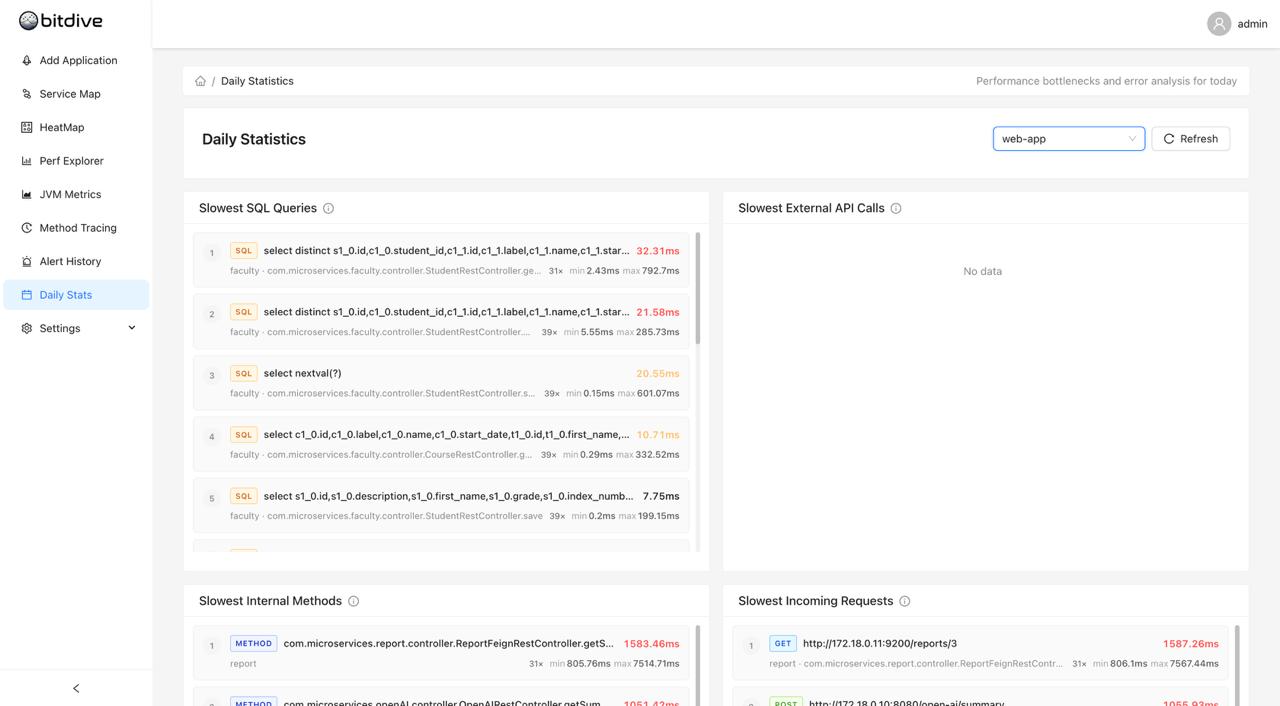
At the top of the page you can select the application module (e.g. web-app) and refresh data.
The page is divided into two zones: performance monitoring cards (slowest operations) and error analysis.
Performance Monitoring
Four cards highlight today's slowest operations:
| Card | Purpose |
|---|---|
| SQL Queries | Detect inefficient queries (e.g. N+1, missing indexes). |
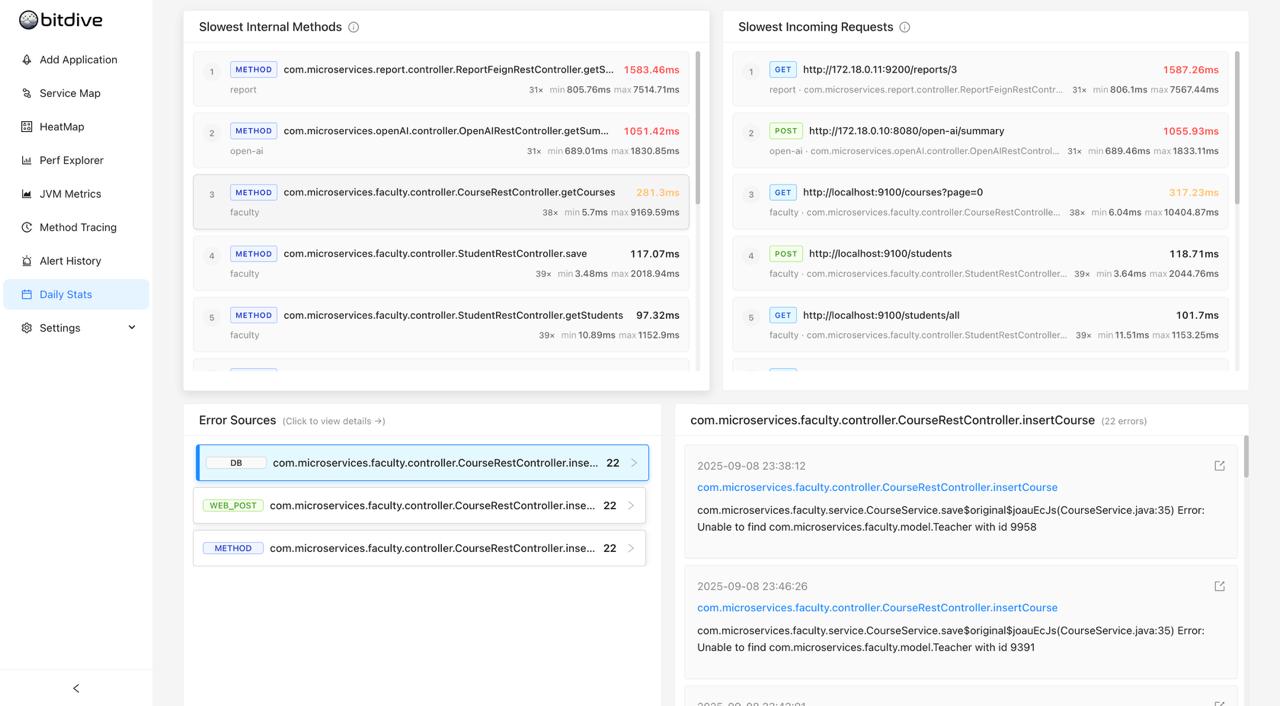
| Internal Methods | Show slow business logic inside services. |
| Incoming Requests | Track endpoints that respond slowly to clients. |
| External API Calls | Identify latency from external dependencies. |
Each entry shows the operation, owning service, execution count, min/max duration, and average duration. Ranking makes the worst offenders appear at the top.
Error Analysis
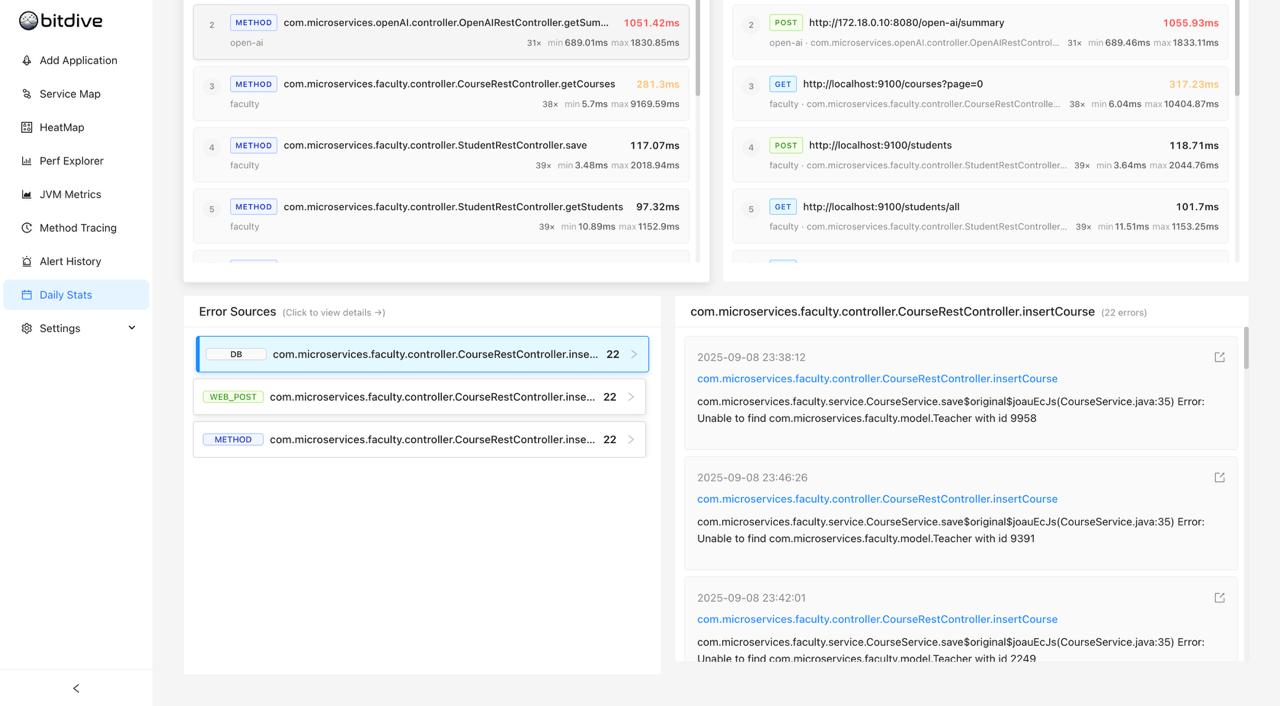
The bottom section aggregates runtime errors. On the left - a list of error sources (database, web requests, or methods) sorted by error count. On the right - detailed error log with timestamps, messages, and links to method traces for root cause analysis.
How Developers Use It
Start with SQL queries and incoming requests to find the biggest bottlenecks. Check internal methods to locate heavy business logic. Review the error panel to see recurring failures. For deeper investigation, follow the trace links directly to the execution flow. Daily Statistics gives you a fast way to move from symptom to root cause in a single screen.