Spring Boot Integration Testing: Full Context, Stubbed Boundaries, Zero Flakiness
· 10 min read

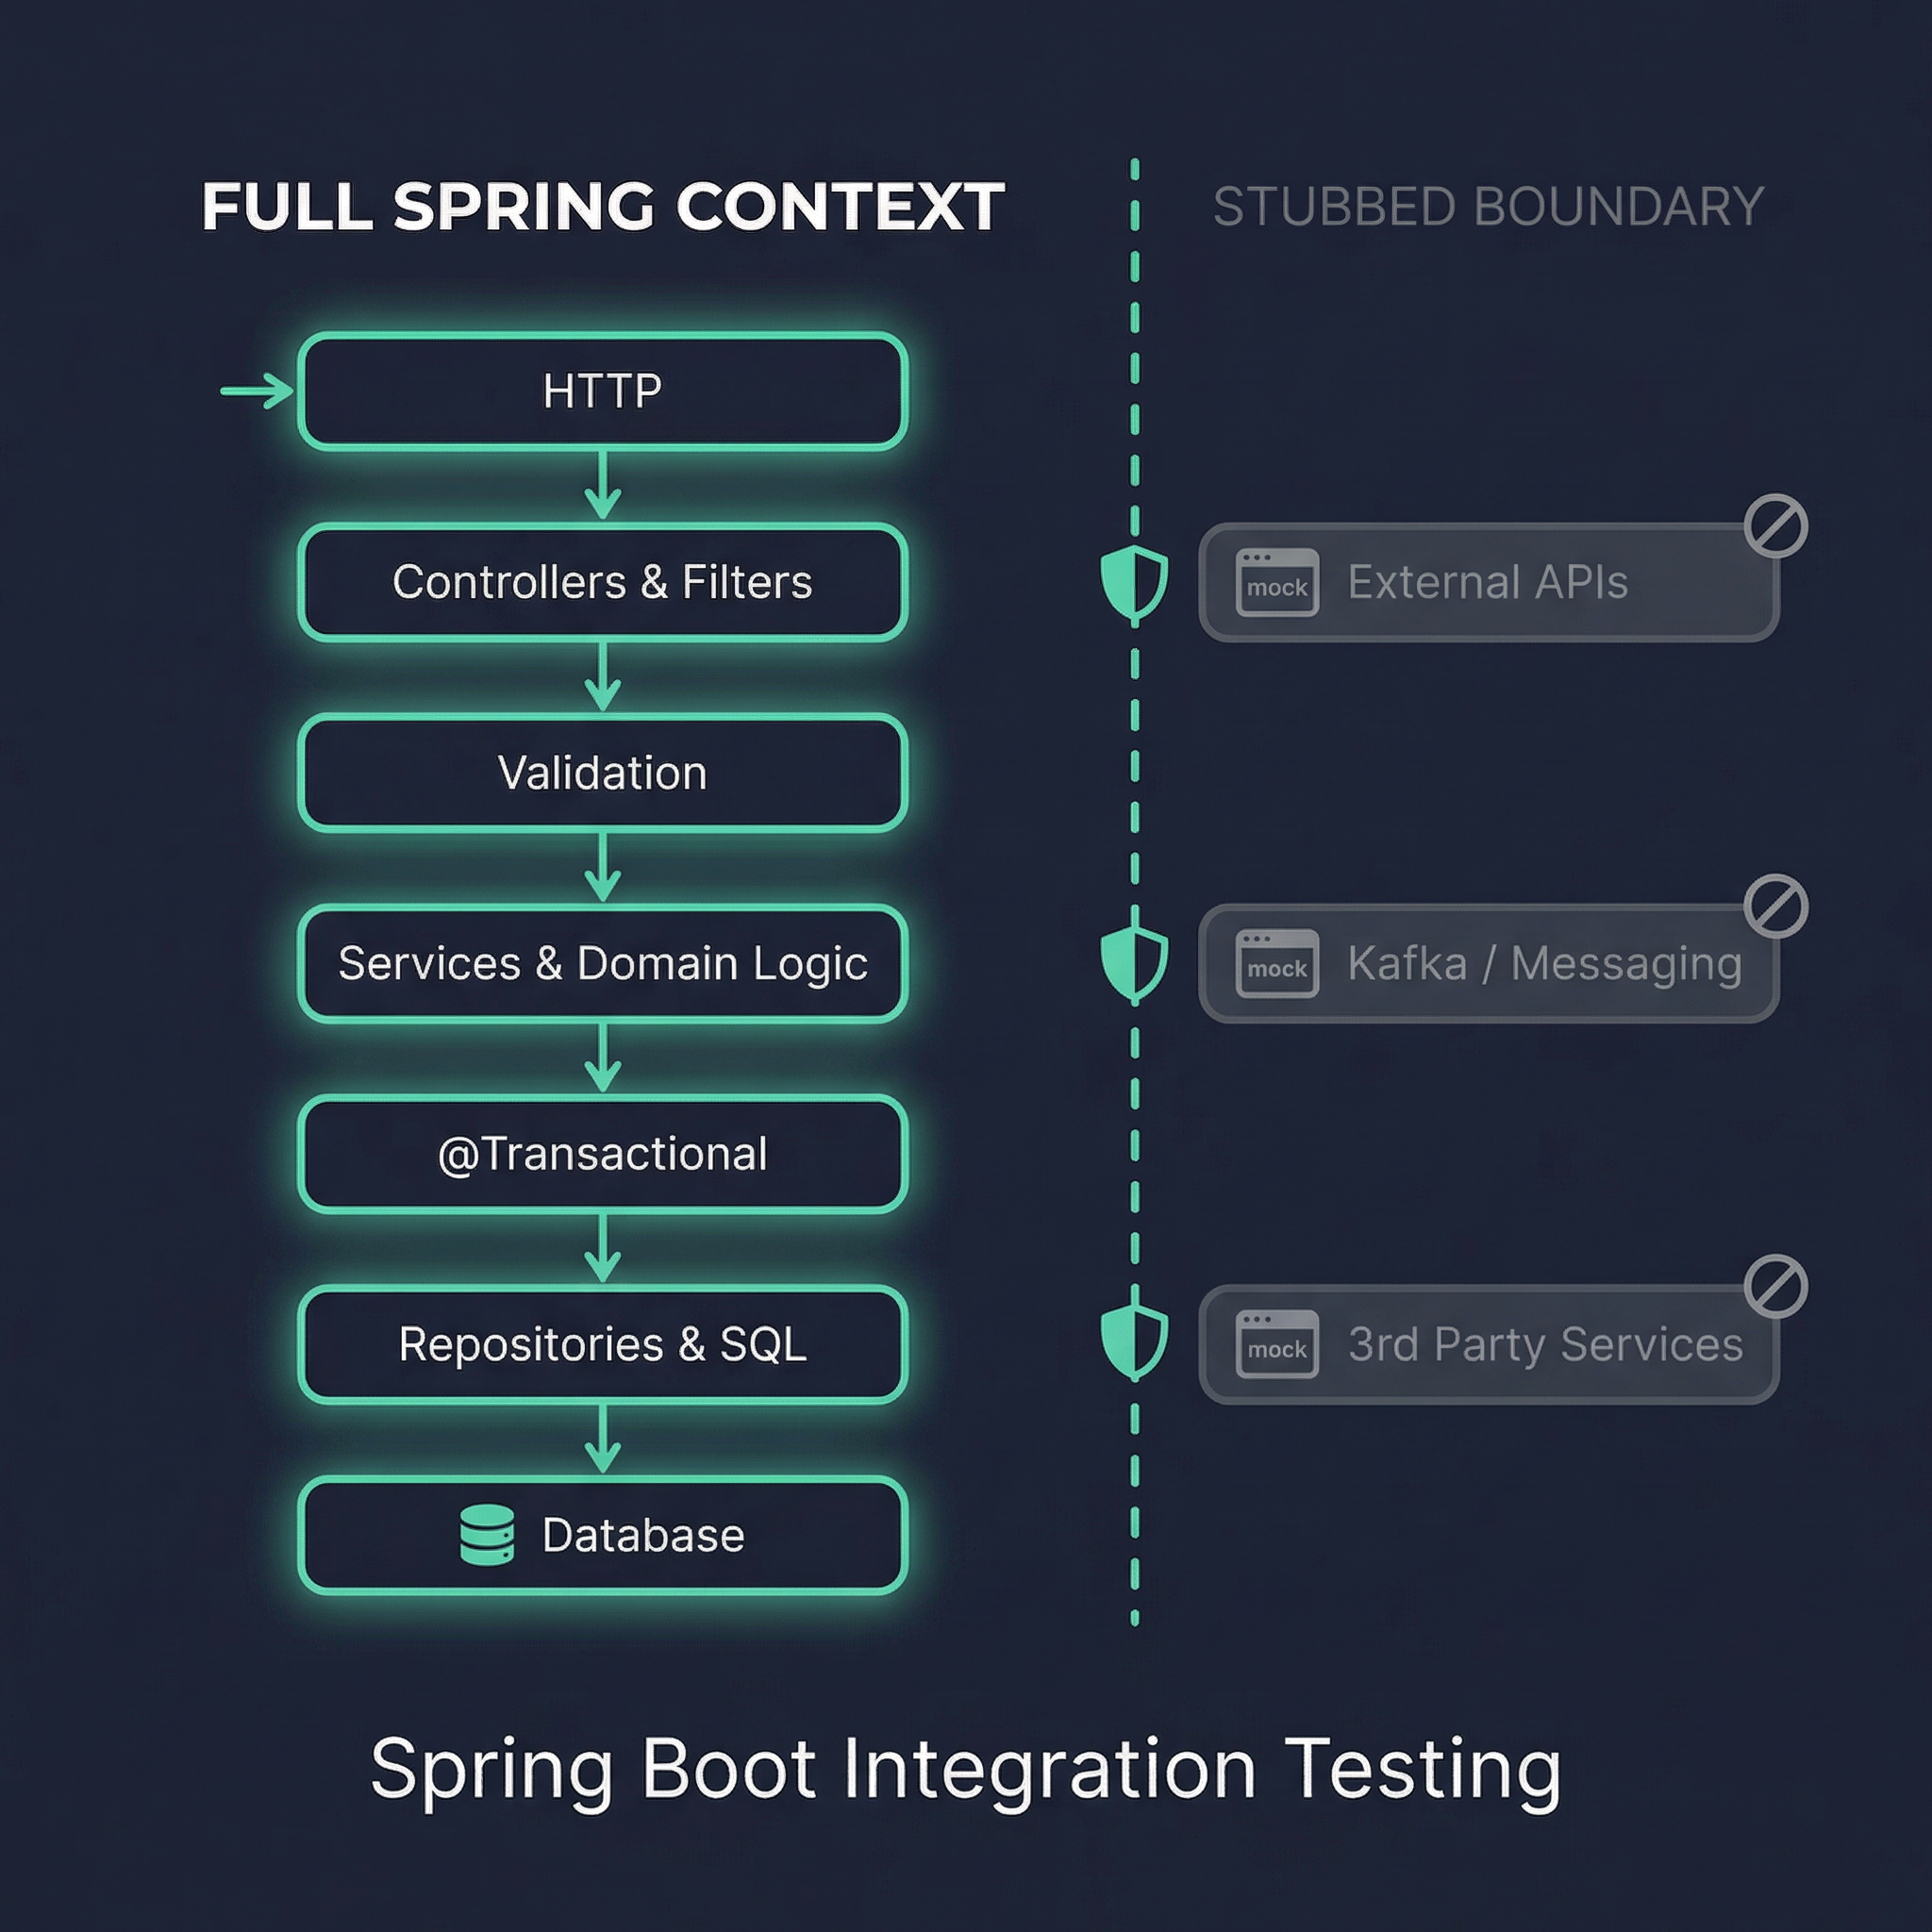
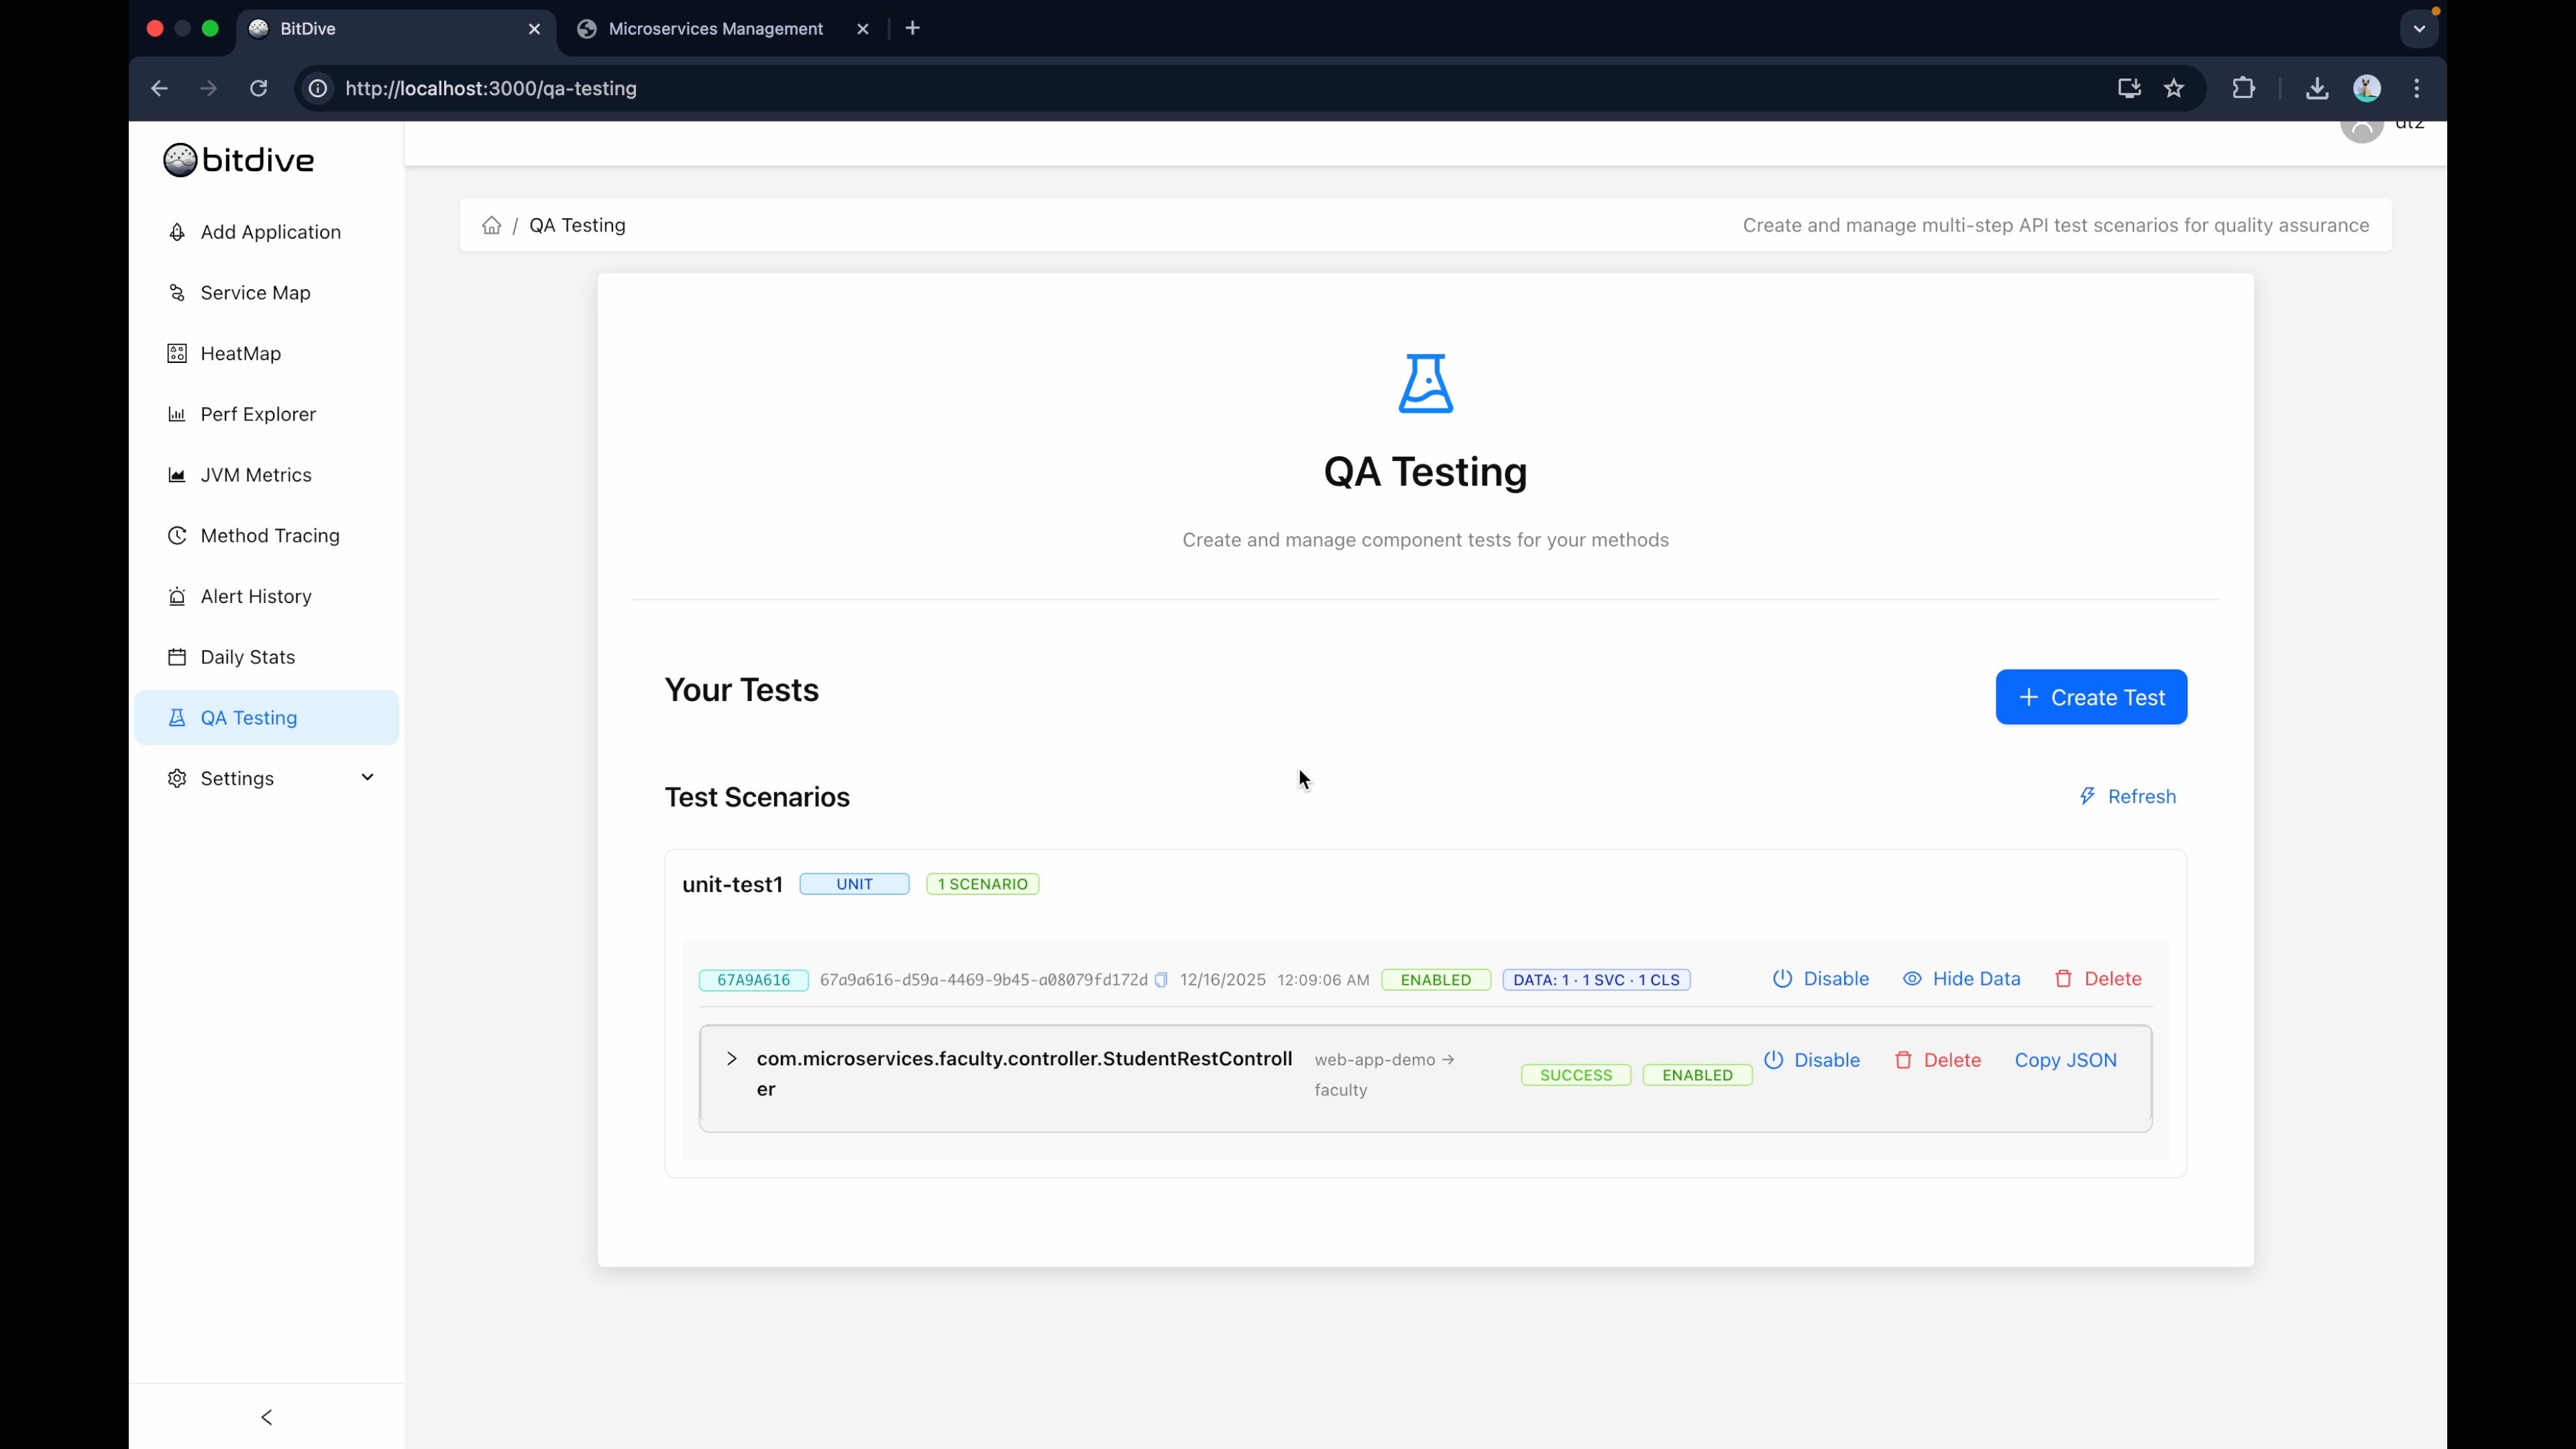
TL;DR: Boot the full Spring context. Stub only what lives outside your service boundary: Feign clients, external HTTP APIs, outbound Kafka. Then hit the service through its real HTTP endpoint and verify the entire chain: controller, validation, service logic, @Transactional, repository, database write, response serialization. This is what Spring calls an integration test. It catches the class of bugs that unit tests structurally miss: broken configs, silent serialization changes, transaction proxy bypass, security filter misconfiguration, and DTO contract drift.