QA in AI Assisted Development: Safety through Deterministic Verification

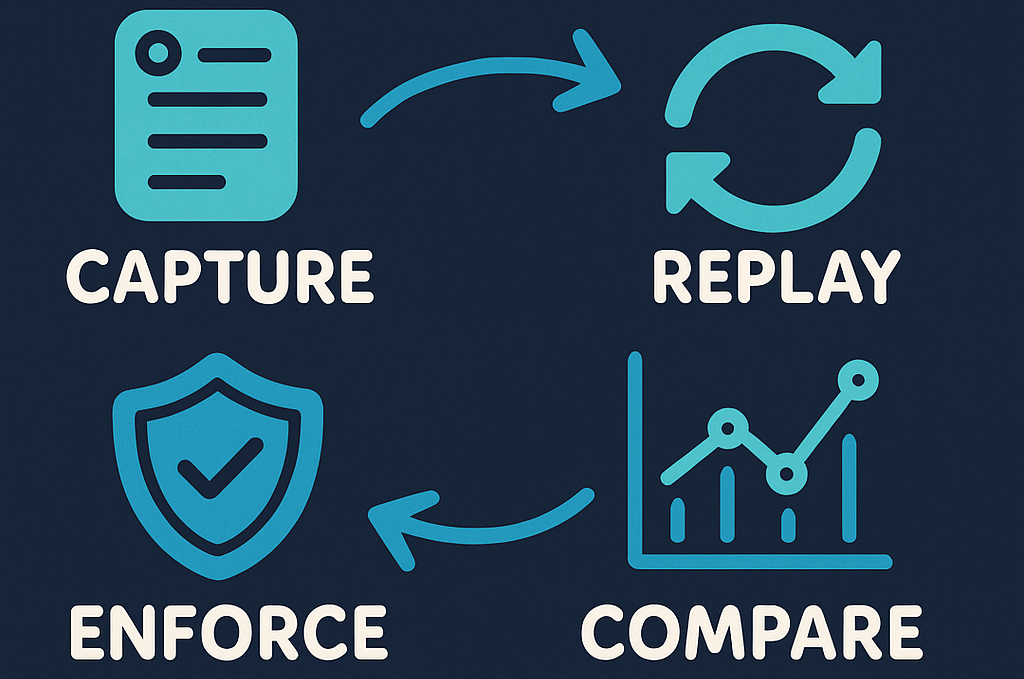
To solve the Verification Crisis, teams must move from manual mocking to Runtime Context Sharing. By integrating BitDive via Model Context Protocol (MCP) docs, AI agents gain access to real execution traces, allowing them to propose surgical fixes and self-verify their work against the baseline trace. This is more than just automation; it is the Deterministic Verification Layer required for the AI-native developer.
"We're now cooperating with AIs and usually they are doing the creation and we as humans are doing the verification. It is in our interest to make this loop go as fast as possible. So, we're getting a lot of work done."
. Andrej Karpathy: Software Is Changing (Again)
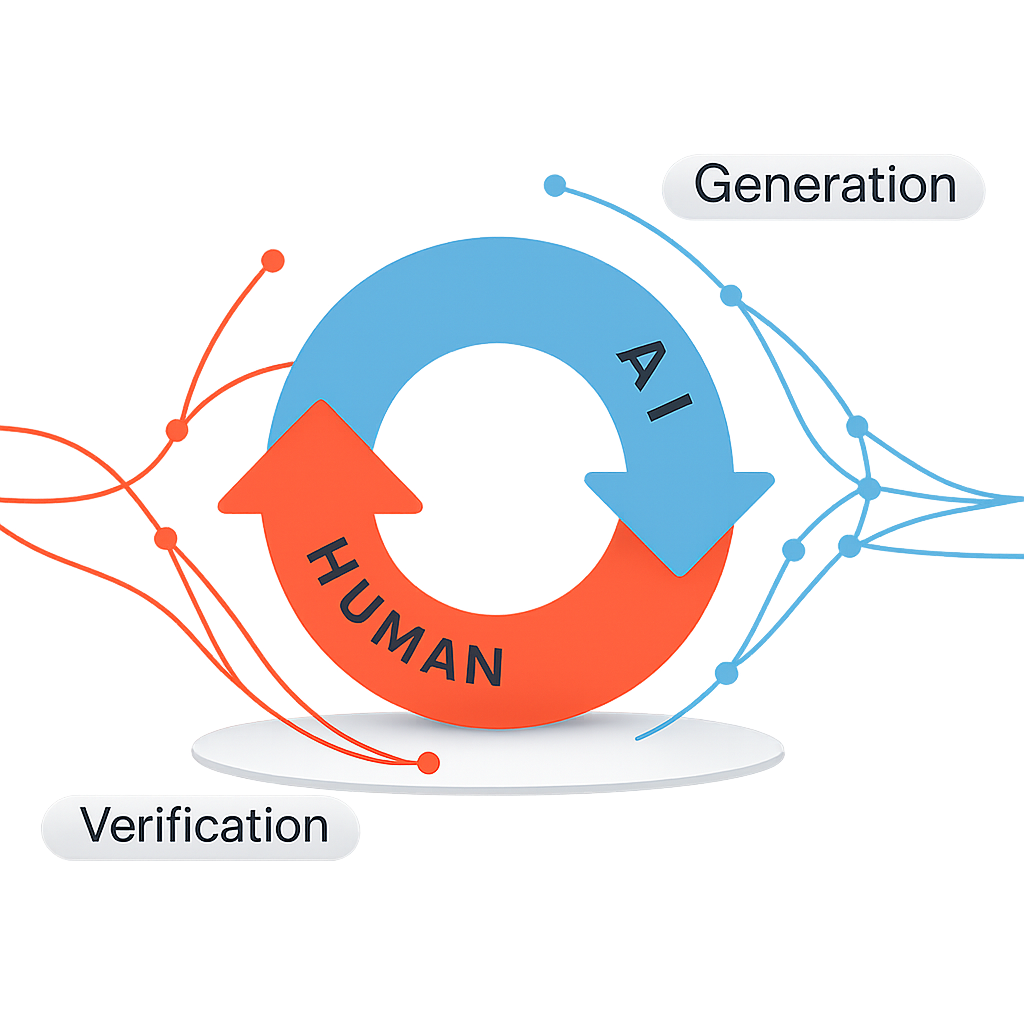
This quote describes a shift that is already visible in many teams. Code creation has accelerated. Verification and validation increasingly become the bottleneck.
With AI tools, writing code is often not the limiting factor anymore. The hard part is proving that what was generated is correct, safe, and maintainable.