
9 posts tagged with "Performance Analysis"

View All Tags

BitDive 1.2.6: WebSocket Support, Daily Statistics, and On-Air Configuration

· 3 min read
Evgenii Frolikov
Senior Java Architect | Expert in High-Load Systems & JVM Internals

BitDive 1.2.6 Release - Introducing WebSocket support, daily performance stats, and live agent configuration

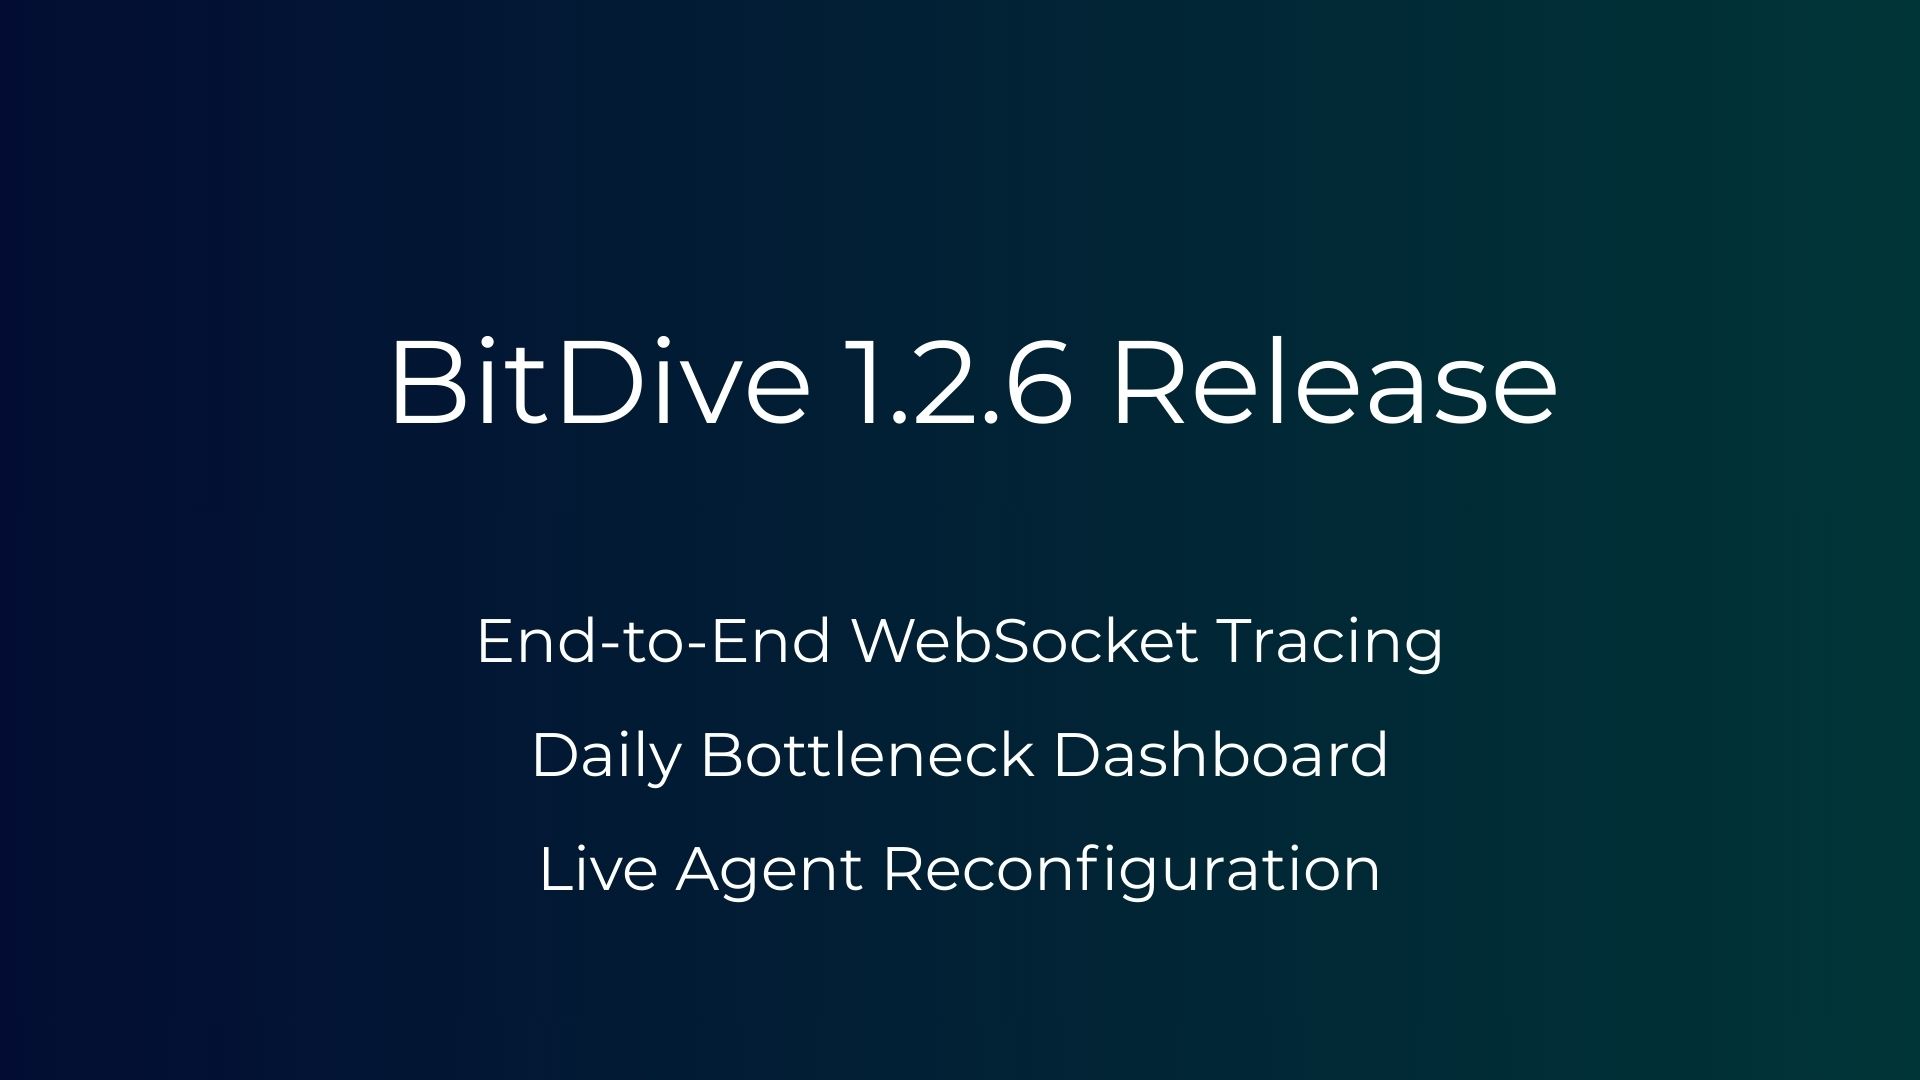
We're excited to announce the release of BitDive 1.2.6, bringing new capabilities that make Runtime Observability for JVM applications even more powerful and developer-friendly. This update expands protocol coverage, adds a new analytics view, and introduces flexible agent configuration - all designed to help teams move faster from problem detection to resolution using Real Runtime Data.

BitDive SaaS Is Live - Try It Free Today

· 3 min read
Dmitry Turmyshev
Product Manager | Developer Experience and Software Quality

Instant Runtime Observability. Stop setting up infrastructure and start verifying behavior. BitDive SaaS is the fastest entry point for teams moving to Trace-Based Testing and automated unit test creation in the cloud.


BitDive SaaS Is Live

We're excited to announce the launch of BitDive SaaS - our fully hosted, cloud-based observability platform built for modern Java microservices. This launch marks a major milestone in making deep performance tracing and real-time insight available to everyone, instantly and effortlessly.

Now, instead of setting up infrastructure or maintaining backend components, developers can get started in just minutes. The BitDive agent connects your application to our platform, and you're immediately able to trace distributed requests, profile methods, visualize service dependencies, and capture Real Runtime Data - all in a single place.

BitDive MCP Server brings full runtime context to development

· 5 min read
Dmitry Turmyshev
Product Manager | Developer Experience and Software Quality

Yesterday, we announced the Model Context Protocol (MCP) Server integration for BitDive. This new capability allows you to access full runtime context for any method executed in production. including input parameters, return values, exceptions, SQL queries, and downstream calls. MCP turns observability into a daily development tool, providing Real Runtime Data directly to your AI agent.

eBPF vs. BitDive: Why AI Agents Need Runtime Context, Not Just Kernel Syscalls

· 8 min read
Evgenii Frolikov
Senior Java Architect | Expert in High-Load Systems & JVM Internals

TL;DR: eBPF is great for monitoring kernels, but it’s blind to business logic. For AI agents to effectively fix code, they need Real Runtime Data context: classes, methods, and parameters. BitDive delivers the exact Runtime Context that AI models (and humans) need to solve real application problems.


eBPF vs BitDive - Main Image

eBPF vs BitDive: Why AI Agents Need Runtime Context

Why do we need production profiling at all?

Application performance isn't abstract. It's about real issues: errors, timeouts, lost users, and wasted money. But to understand what exactly is slow, it's not enough to know that "CPU is high." You need detail: which service, which method, which request, which parameters — the kind of code-level observability that only application-level instrumentation can provide.

Understanding the Differences: Observability vs. Monitoring vs. APM vs. Profiling

· 4 min read
Dmitry Turmyshev
Product Manager | Developer Experience and Software Quality

TL;DR: Modern Observability is incomplete without Automated Verification. While APM and Monitoring tell you what is happening, BitDive uses runtime traces to create Trace Replay suites, closing the loop between seeing a performance issue and ensuring it never returns.


In today's cloud-native environments, maintaining optimal application performance requires multiple complementary approaches. While these tools share some features, they serve distinct purposes in modern performance management.

Venn diagram illustrating the relationships and overlaps between Observability, Monitoring, APM, and Profiling

Application Performance Management (APM)

APM's evolution reflects the changing landscape of application architecture. Originally designed for monolithic applications, modern APM tools now handle the complexities of distributed systems and microservices.

How can you measure software performance?

· 4 min read
Dmitry Turmyshev
Product Manager | Developer Experience and Software Quality

TL;DR: Metrics are just the baseline; Behavior is the goal. Measuring throughput and latency is essential, but in 2026, BitDive elevates this by monitoring Unexpected Behavior Changes. By comparing real-world execution traces against baseline replays, we ensure that performance gains don't come at the cost of correctness, providing the Real Runtime Data for your PRs.


Software Performance Metrics - Analyzing throughput and latency for Java application optimization

Performance testing is crucial for software success, ensuring systems meet user expectations and business requirements. This guide explores core performance testing concepts and provides actionable strategies for effective implementation.

Enhancing Application Performance, Strategies for Optimization

· 13 min read
Dmitry Turmyshev
Product Manager | Developer Experience and Software Quality

TL;DR: True optimization requires verification. Improving application speed is a wasted effort if a subsequent code change brings back the bottleneck. BitDive uses runtime traces to create deterministic Performance Regression tests, ensuring your optimizations stick and mission-critical logic remains fast in every build.


Application Performance Optimization

Imagine your app as a sleek sports car in a high-stakes race. Every millisecond of lag is like a hiccup in the engine, potentially costing you the lead, and in this case, valuable users and revenue. But fear not, digital speed demons! We're about to pop the hood and reveal the secrets of turbocharged app performance. From code optimization tricks that would make a Formula 1 engineer jealous, to scaling strategies that could handle a million users without breaking a sweat, we're covering it all.

Using Flame Graphs to Visualize Method Execution Times in Distributed Systems

· 5 min read
Evgenii Frolikov
Senior Java Architect | Expert in High-Load Systems & JVM Internals

TL;DR: The Trace is the Test. In distributed microservices, BitDive captures cross-service spans and transforms them into deterministic JUnit Replay Plans. By using flame graphs as the blueprint, BitDive allows you to verify complex distributed logic end-to-end as Real Runtime Data.


At BitDive.io, we leverage flame graphs not for traditional CPU profiling, but for visualizing the time (in milliseconds) that each method in a span consumes. This approach is especially suited for distributed systems with microservices running across different servers and processors. In this post, we will explain why flame graphs are effective for this use case, how they can help uncover bottlenecks in distributed architectures, and why this method could be more suitable for your system's needs.

Unlocking Performance Bottlenecks with Flame Graphs

· 8 min read
Dmitry Turmyshev
Product Manager | Developer Experience and Software Quality

TL;DR: Flame Graphs are not just for visualization; they are the blueprint for Automated JUnit Testing. BitDive uses the same instrumentation technology that creates these graphs to record method-level inputs and outputs, transforming "passive observability" into Automated Verification.


Interactive CPU Flame Graph - Visualizing Java stack traces and performance bottlenecks with BitDive

Imagine you're an engineer at a bustling tech company, racing against time to make your app lightning-fast. Your code is a maze, and somewhere in there lurks a sneaky performance bottleneck. Enter flame graphs: the secret weapon of modern software optimization. Born from the brilliant mind of Brendan Gregg, these visual tools have become the go-to for tech giants and startups alike. They're not just graphs; they're x-ray vision for your code, revealing hidden CPU hogs that could be costing your business millions. In a world where milliseconds can make or break user experience (and profits), flame graphs have emerged as the unsung heroes of the enterprise tech world. Curious about how they're transforming the way we build and optimize software? Let's dive in and uncover the fiery truth behind these game-changing tools.