Understanding the Differences: Observability vs. Monitoring vs. APM vs. Profiling

TL;DR: Modern Observability is incomplete without Automated Verification. While APM and Monitoring tell you what is happening, BitDive uses runtime traces to create Trace Replay suites, closing the loop between seeing a performance issue and ensuring it never returns.
In today's cloud-native environments, maintaining optimal application performance requires multiple complementary approaches. While these tools share some features, they serve distinct purposes in modern performance management.
Application Performance Management (APM)
APM's evolution reflects the changing landscape of application architecture. Originally designed for monolithic applications, modern APM tools now handle the complexities of distributed systems and microservices.
Key capabilities include:
- Resource metrics and transaction response times
- User experience metrics and error rates
- Cross-service performance analysis
- Anomaly detection and predictive analytics
Example: An e-commerce platform uses APM to track checkout flow performance, ensuring transaction success rates meet business requirements while monitoring user experience across different regions.
Monitoring
Monitoring provides real-time tracking of system health through predefined metrics, answering "what's happening now?"
Key aspects include:
- System-level metrics and service availability
- Resource utilization and error rates
- Threshold-based alerting
- Basic performance indicators
Example: A cloud-based CRM system uses monitoring to track API endpoint availability and response times, triggering alerts when thresholds are exceeded.
Observability
Observability takes a holistic approach to understanding system behavior in complex distributed environments.
Core elements include:
- Integration of metrics, logs, and traces
- Service Level Objectives (SLOs) tracking
- Cross-service dependency analysis
- Root cause determination
Example: A streaming service uses observability to understand why users in certain regions experience buffering issues by correlating network metrics, CDN performance, and user behavior data.
Automated Testing: The 5th Pillar
In the AI era, observability and testing are merging. Traditional observability is passive, it collects data for humans to analyze. Runtime Observability uses that same data to drive automated verification.
Why Testing is part of Observability:
- Behavior Verification: Use Real Runtime Data to define what "correct" behavior looks like.
- Regression Safety: Any performance bottleneck identified via profiling should be turned into a regression test to prevent it from ever reaching production again.
- AI Feedback Loop: Give AI agents the runtime context (traces) so they can verify their own code changes against real-world scenarios.
Example: A developer identifies a slow SQL query via APM. Instead of just fixing it, they use BitDive to capture the trace and create a JUnit test that asserts the query count remains optimal in future builds.
Don't Just Observe, Verify
BitDive bridges the gap between Observability and Testing. Turn your runtime traces into stable, trace-based JUnit tests today.
Get Started with BitDiveOverlaps and Distinctions
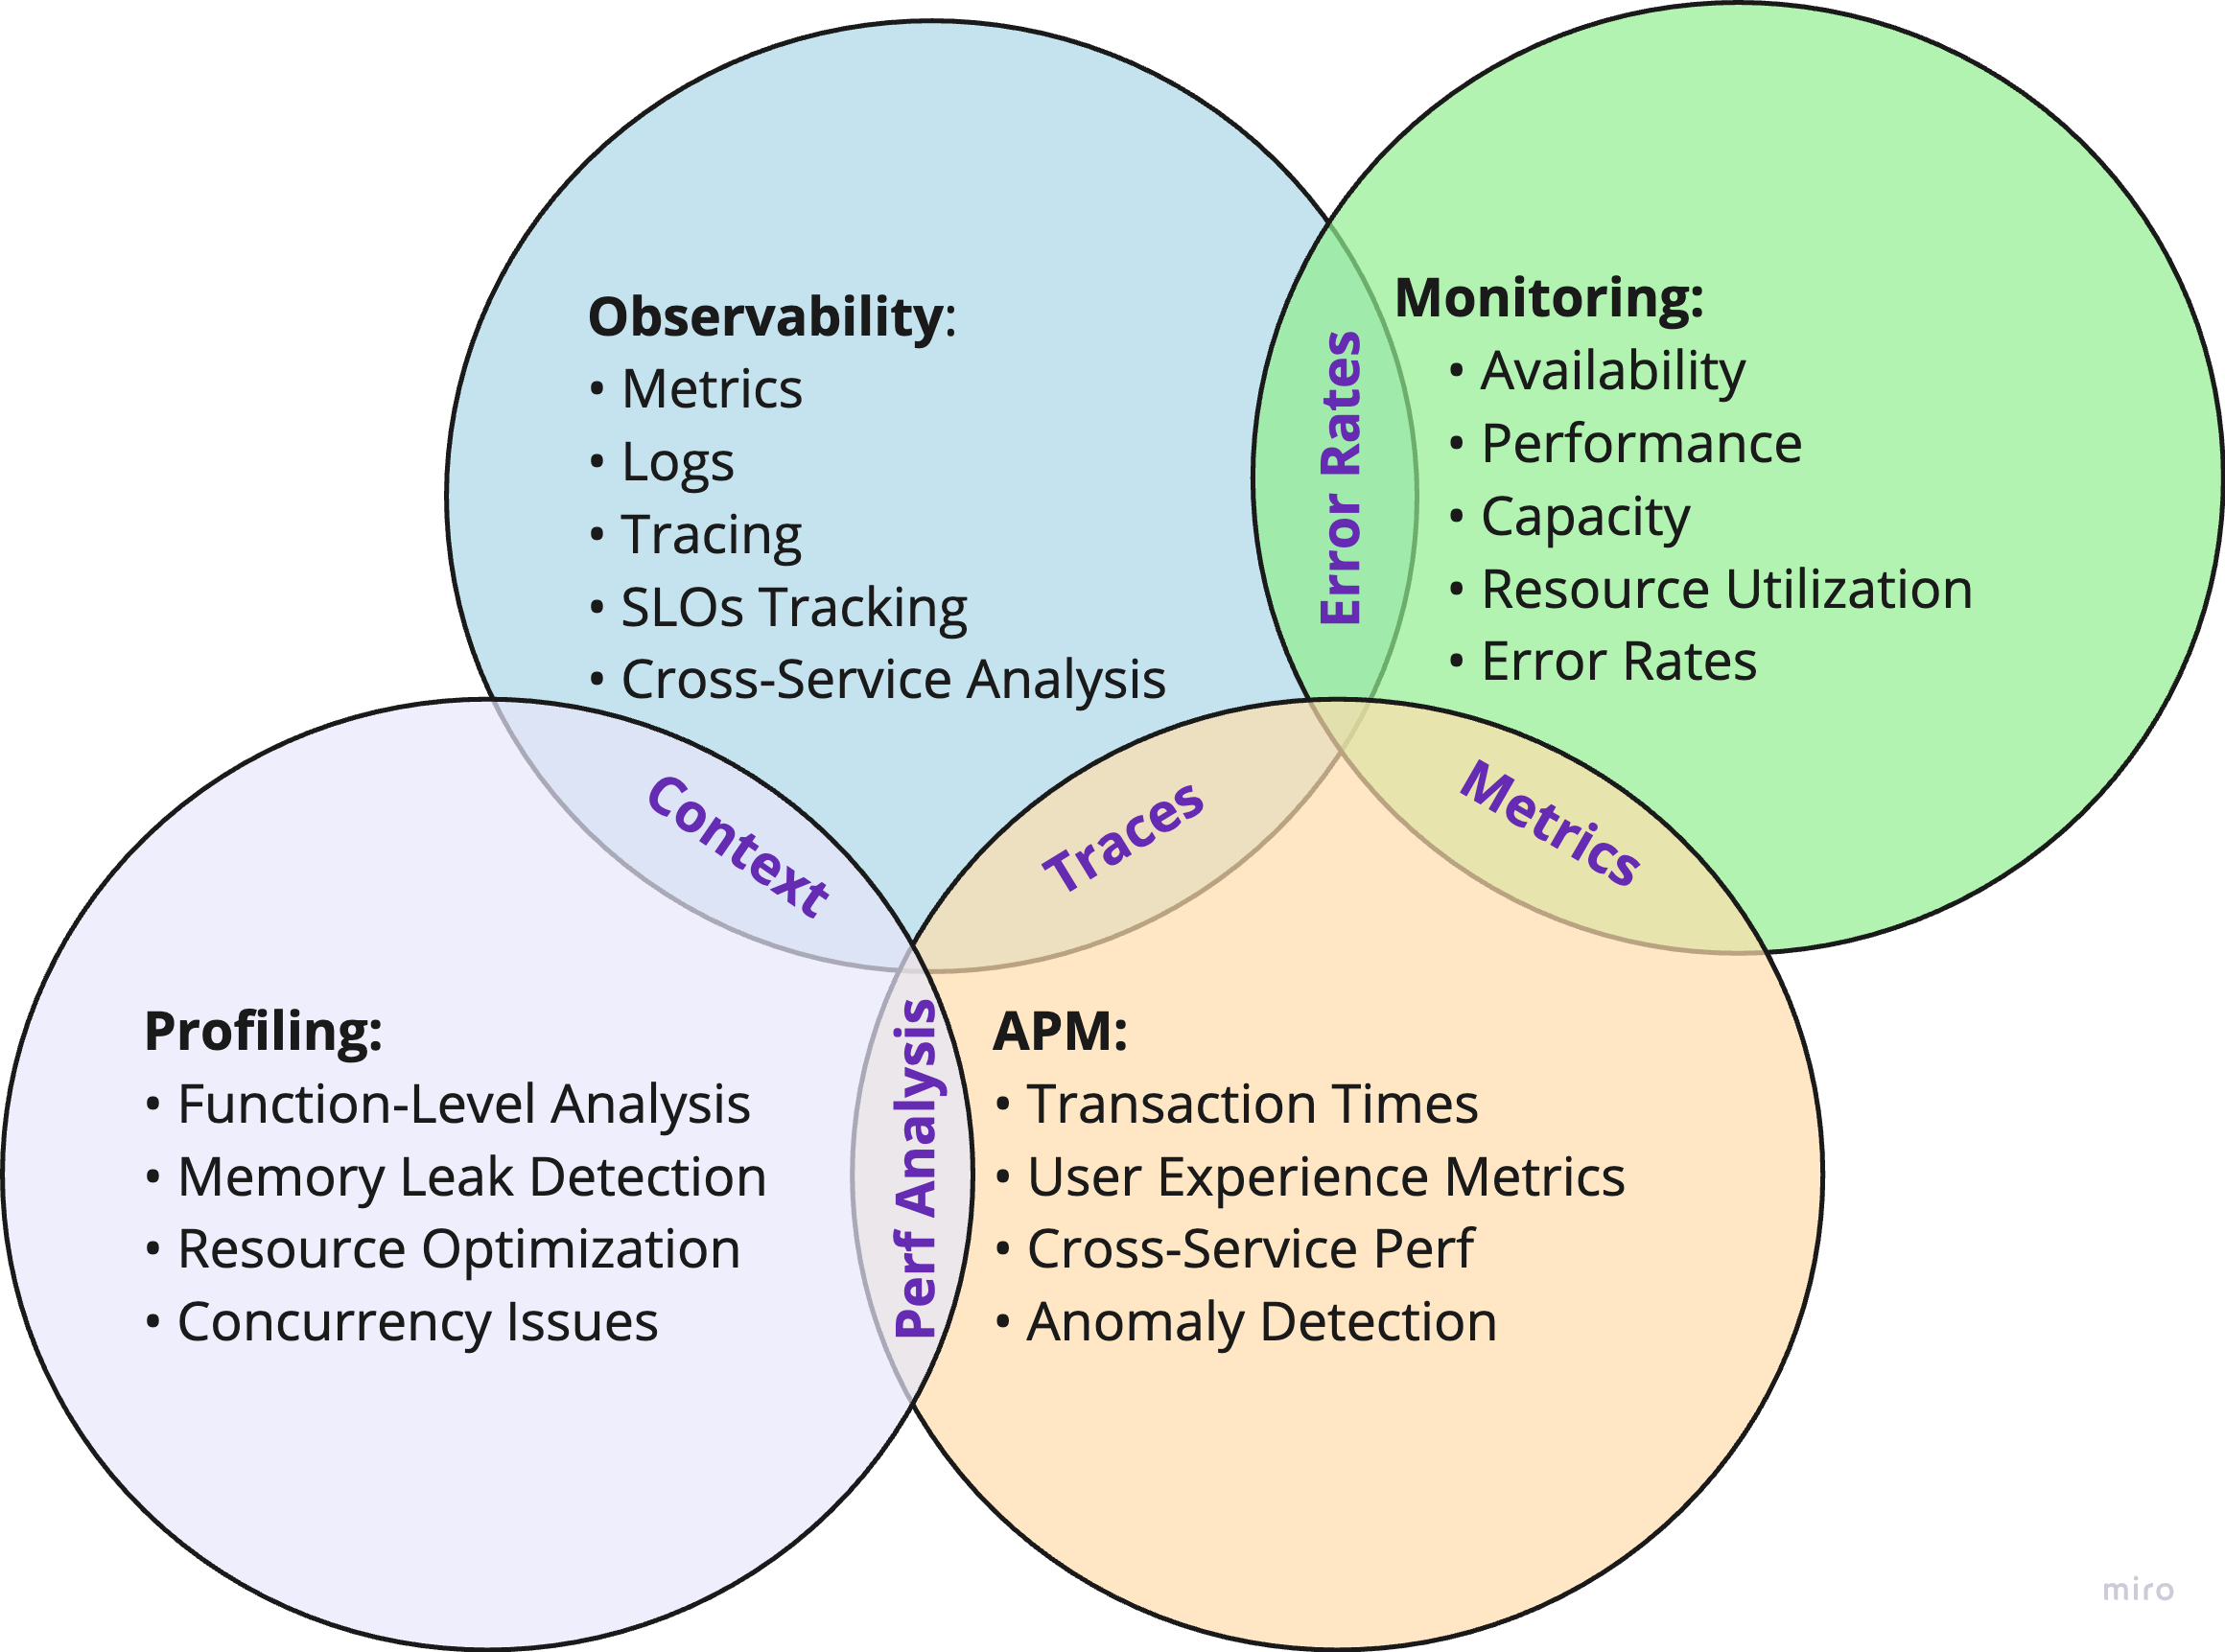
While these tools share capabilities, their focus differs:
- APM and Observability: Both use traces, but observability emphasizes correlation across the entire system.
- Monitoring and APM: Both track metrics, but APM provides deeper application-specific insights.
- Observability and Profiling: Both aid troubleshooting, but at different levels of granularity.
Integration in Practice
Modern organizations typically combine these five approaches:
- Monitoring for immediate health alerts.
- Observability for system-wide understanding.
- APM for user experience tracking.
- Profiling for code-level optimization and observability.
- Trace-Based Testing for ensuring behavioral consistency.
Example: A financial services app uses monitoring for uptime, observability for transaction flow, APM for UX, profiling to optimize algorithms, and BitDive to ensure that AI-generated updates don't break the mission-critical logic.
Conclusion
By integrating these complementary approaches, organizations can build a comprehensive performance management strategy that addresses both high-level system health and granular optimization needs in modern cloud environments. Success lies in understanding each tool's strengths and implementing them in a way that supports overall business objectives while managing integration challenges effectively.
With these tools, you can comprehensively manage application performance and ensure smooth operations.
Learn more about CPU Flamegraph Guide.
Explore Method Execution Analysis.
Measure software performance with Key JVM Metrics.
Learn more about Application Performance Optimization.
Check our Engineering Glossary for more technical terms.
Listen to the Audio Version
If you prefer, you can listen to the automatically generated audio version of this post, which covers key performance management tools like observability, monitoring, APM, and profiling.