Your Service Passes All Tests But Breaks Production: Detecting Inter-Service API Regression
· 8 min read


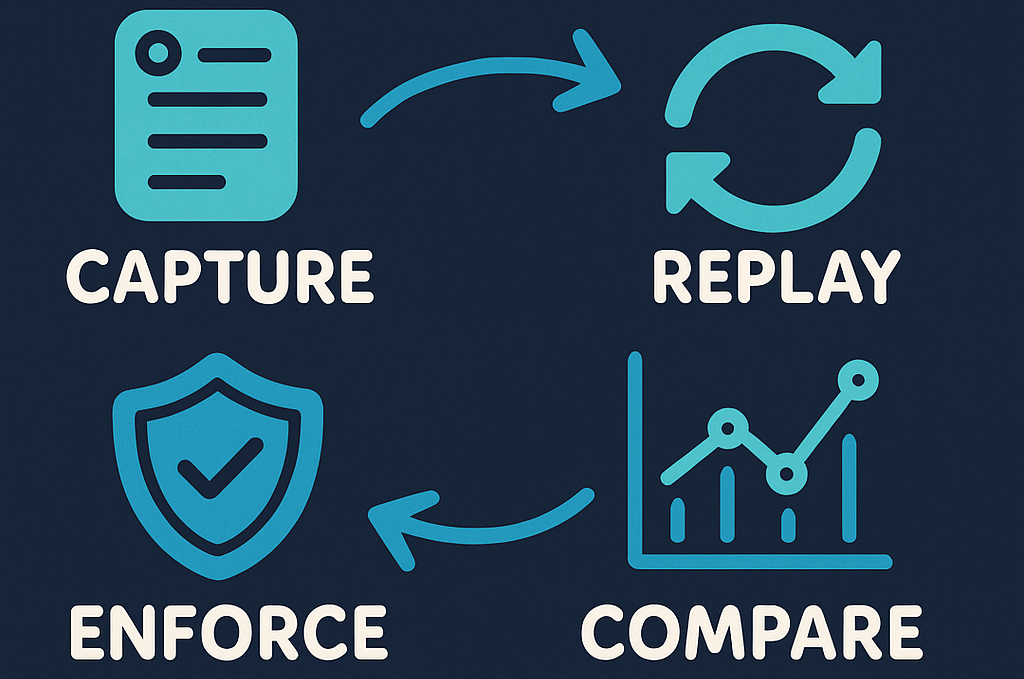
TL;DR: The most dangerous bugs in microservices are not inside a service. They are between services. A code change can make a service pass all its local tests while silently altering what it sends to downstream APIs: different payload, missing header, changed error format. These regressions are invisible to unit tests, hard to catch with contract tests, and expensive in production. BitDive detects them by capturing real HTTP exchanges in execution traces and comparing them before and after a code change.