
BitDive SaaS Is Live - Try It Free Today

· 3 min read
Dmitry Turmyshev
Product Manager | Developer Experience and Software Quality

Instant Runtime Observability. Stop setting up infrastructure and start verifying behavior. BitDive SaaS is the fastest entry point for teams moving to Trace-Based Testing and automated unit test creation in the cloud.


BitDive SaaS Is Live

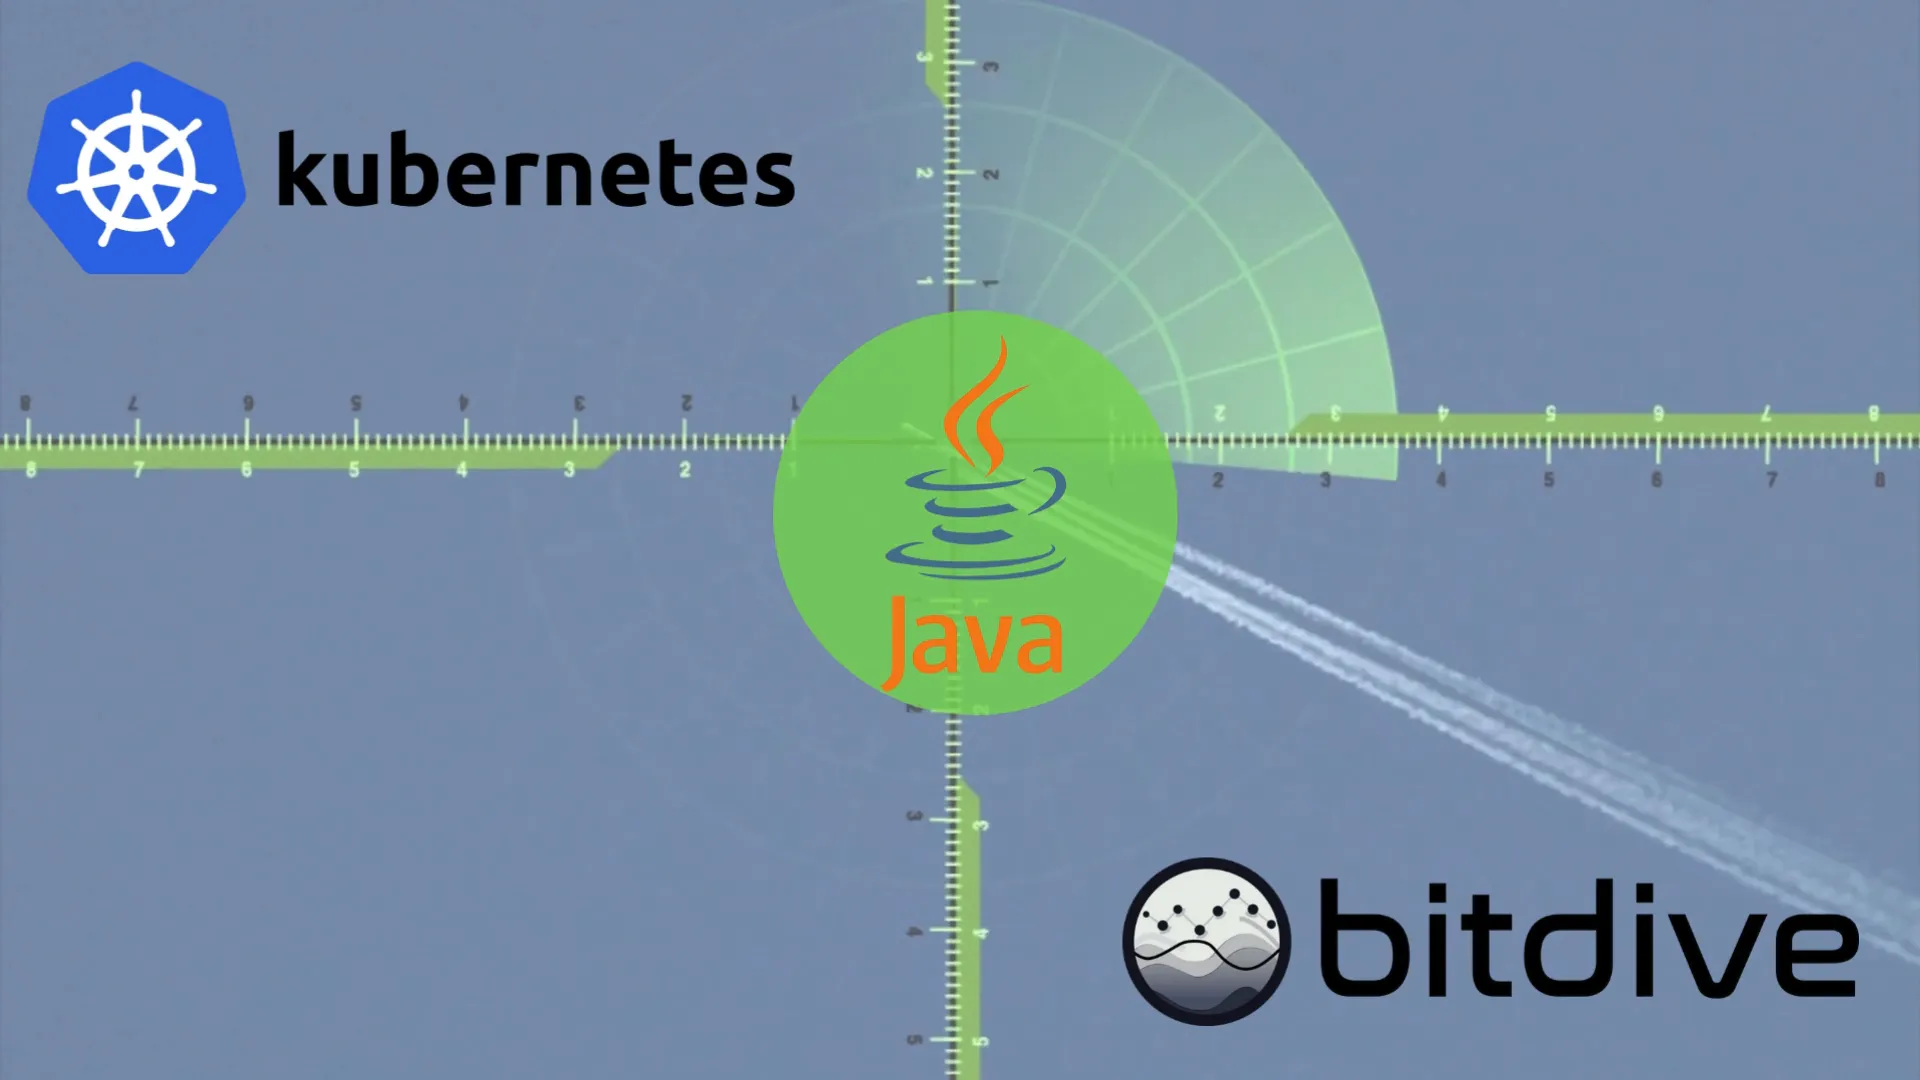
We're excited to announce the launch of BitDive SaaS - our fully hosted, cloud-based observability platform built for modern Java microservices. This launch marks a major milestone in making deep performance tracing and real-time insight available to everyone, instantly and effortlessly.

Now, instead of setting up infrastructure or maintaining backend components, developers can get started in just minutes. The BitDive agent connects your application to our platform, and you're immediately able to trace distributed requests, profile methods, visualize service dependencies, and capture Real Runtime Data - all in a single place.

BitDive MCP Server brings full runtime context to development

· 5 min read
Dmitry Turmyshev
Product Manager | Developer Experience and Software Quality

Yesterday, we announced the Model Context Protocol (MCP) Server integration for BitDive. This new capability allows you to access full runtime context for any method executed in production. including input parameters, return values, exceptions, SQL queries, and downstream calls. MCP turns observability into a daily development tool, providing Real Runtime Data directly to your AI agent.

eBPF vs. BitDive: Why AI Agents Need Runtime Context, Not Just Kernel Syscalls

· 8 min read
Evgenii Frolikov
Senior Java Architect | Expert in High-Load Systems & JVM Internals

TL;DR: eBPF is great for monitoring kernels, but it’s blind to business logic. For AI agents to effectively fix code, they need Real Runtime Data context: classes, methods, and parameters. BitDive delivers the exact Runtime Context that AI models (and humans) need to solve real application problems.


eBPF vs BitDive - Main Image

eBPF vs BitDive: Why AI Agents Need Runtime Context

Why do we need production profiling at all?

Application performance isn't abstract. It's about real issues: errors, timeouts, lost users, and wasted money. But to understand what exactly is slow, it's not enough to know that "CPU is high." You need detail: which service, which method, which request, which parameters — the kind of code-level observability that only application-level instrumentation can provide.

BitDive is Now on GoodFirms

· One min read
Dmitry Turmyshev
Product Manager | Developer Experience and Software Quality

We're excited to announce that BitDive is now featured on GoodFirms, a leading platform for software reviews and recommendations!

BitDive brings code-level observability, distributed tracing, and real-time profiling to modern Java applications, especially in Kubernetes environments.

Explore our profile to learn how BitDive can revolutionize your application monitoring with method-level insights and seamless integration.

Check out our profile at GoodFirms and leave us a review!

👉 Discover BitDive Engineering Terminology in our Glossary

Monitoring and Distributed Tracing for Java in Kubernetes with BitDive

· 5 min read
Dmitry Turmyshev
Product Manager | Developer Experience and Software Quality

TL;DR: Cloud-native observability shouldn't require root access or manual instrumentation inside containers. BitDive provides a Trace-Based Quality Gate for Kubernetes, capturing method-level traces from pods and transforming them into Trace Replay suites that run anywhere.


Java Observability in Kubernetes

Monitoring and Optimizing Java Workloads in Kubernetes with BitDive

Monitoring and optimizing Java workloads in Kubernetes presents unique challenges. From the dynamic nature of microservices to the complexity of distributed systems, traditional tools often fall short. BitDive offers a revolutionary approach to code-level observability and real-time monitoring, purpose-built for Kubernetes environments.

Application Monitoring - Keep Your Finger on the Pulse of Your Systems

· 4 min read
Evgenii Frolikov
Senior Java Architect | Expert in High-Load Systems & JVM Internals

TL;DR: Traditional monitoring is a defensive measure. BitDive turns monitoring into an offensive quality strategy by closing the loop between runtime observations and automated Trace Replay. Stop just watching your metrics, start using them to build a self-verifying application based on Real Runtime Data.


BitDive Application Monitoring - Real-time dashboards for Java performance and system health tracking

Modern applications are increasingly becoming business-critical. Unstable performance, prolonged downtime, or a lack of visibility into what's happening inside the system can lead to significant financial losses and reputational damage. Meanwhile, traditional logging-based methods of monitoring often fall short: logs may be insufficient, or they get lost in a massive stream of messages.

Microservices Monitoring - Mastering Distributed System Observability

· 5 min read
Evgenii Frolikov
Senior Java Architect | Expert in High-Load Systems & JVM Internals

TL;DR: Monitoring microservices isn't just about finding bottlenecks, it's about recording the "Golden Path" of cross-service interactions. BitDive captures distributed traces and transforms them into automated Integration Tests, providing the Real Runtime Data for complex service meshes.


BitDive Microservices Monitoring - Centralized observability and distributed tracing for complex Java systems

Microservices architecture offers businesses flexibility, independent development teams, and the ability to scale individual services. However, the more complex and distributed a system is, the more pressing it becomes to have centralized monitoring and a clear view of how services interact.

Automatic Exception Logging - A Key to Proactive Application Monitoring

· 5 min read
Dmitry Turmyshev
Product Manager | Developer Experience and Software Quality

TL;DR: An Exception is an Opportunity. BitDive transforms production errors into Regression Tests. By capturing the full method context during an exception, BitDive provides AI agents with the Real Runtime Data needed to propose a fix and a ready-made test case to verify that the bug never returns.


Automatic Exception Logging

The Challenge of Debugging Distributed Applications

Distributed systems have become the backbone of modern software architecture. But with this complexity comes the challenge of tracking down errors and understanding their impact across multiple services. Relying solely on logs or traditional error-tracking tools often leaves developers frustrated, chasing incomplete information.

That's why BitDive introduces a game-changing solution that combines error interception, distributed tracing, correlation IDs, metrics, and alerts-delivering developers a complete observability toolkit for debugging distributed applications with ease and precision.


Understanding the Differences: Observability vs. Monitoring vs. APM vs. Profiling

· 4 min read
Dmitry Turmyshev
Product Manager | Developer Experience and Software Quality

TL;DR: Modern Observability is incomplete without Automated Verification. While APM and Monitoring tell you what is happening, BitDive uses runtime traces to create Trace Replay suites, closing the loop between seeing a performance issue and ensuring it never returns.


In today's cloud-native environments, maintaining optimal application performance requires multiple complementary approaches. While these tools share some features, they serve distinct purposes in modern performance management.

Venn diagram illustrating the relationships and overlaps between Observability, Monitoring, APM, and Profiling

Application Performance Management (APM)

APM's evolution reflects the changing landscape of application architecture. Originally designed for monolithic applications, modern APM tools now handle the complexities of distributed systems and microservices.