BitDive Performance Explorer
Overview
Performance Explorer is BitDive's powerful analytics tool designed to help engineers analyze JVM application behavior in real time and in detail.
It enables you to examine runtime metrics at every level of your application - from high-level modules, through individual classes, all the way down to specific methods.
This layered drilldown view, paired with precise time-series visualizations, makes it ideal for identifying bottlenecks, regressions, anomalies, and usage patterns across your distributed Java services.
Accessing Performance Explorer
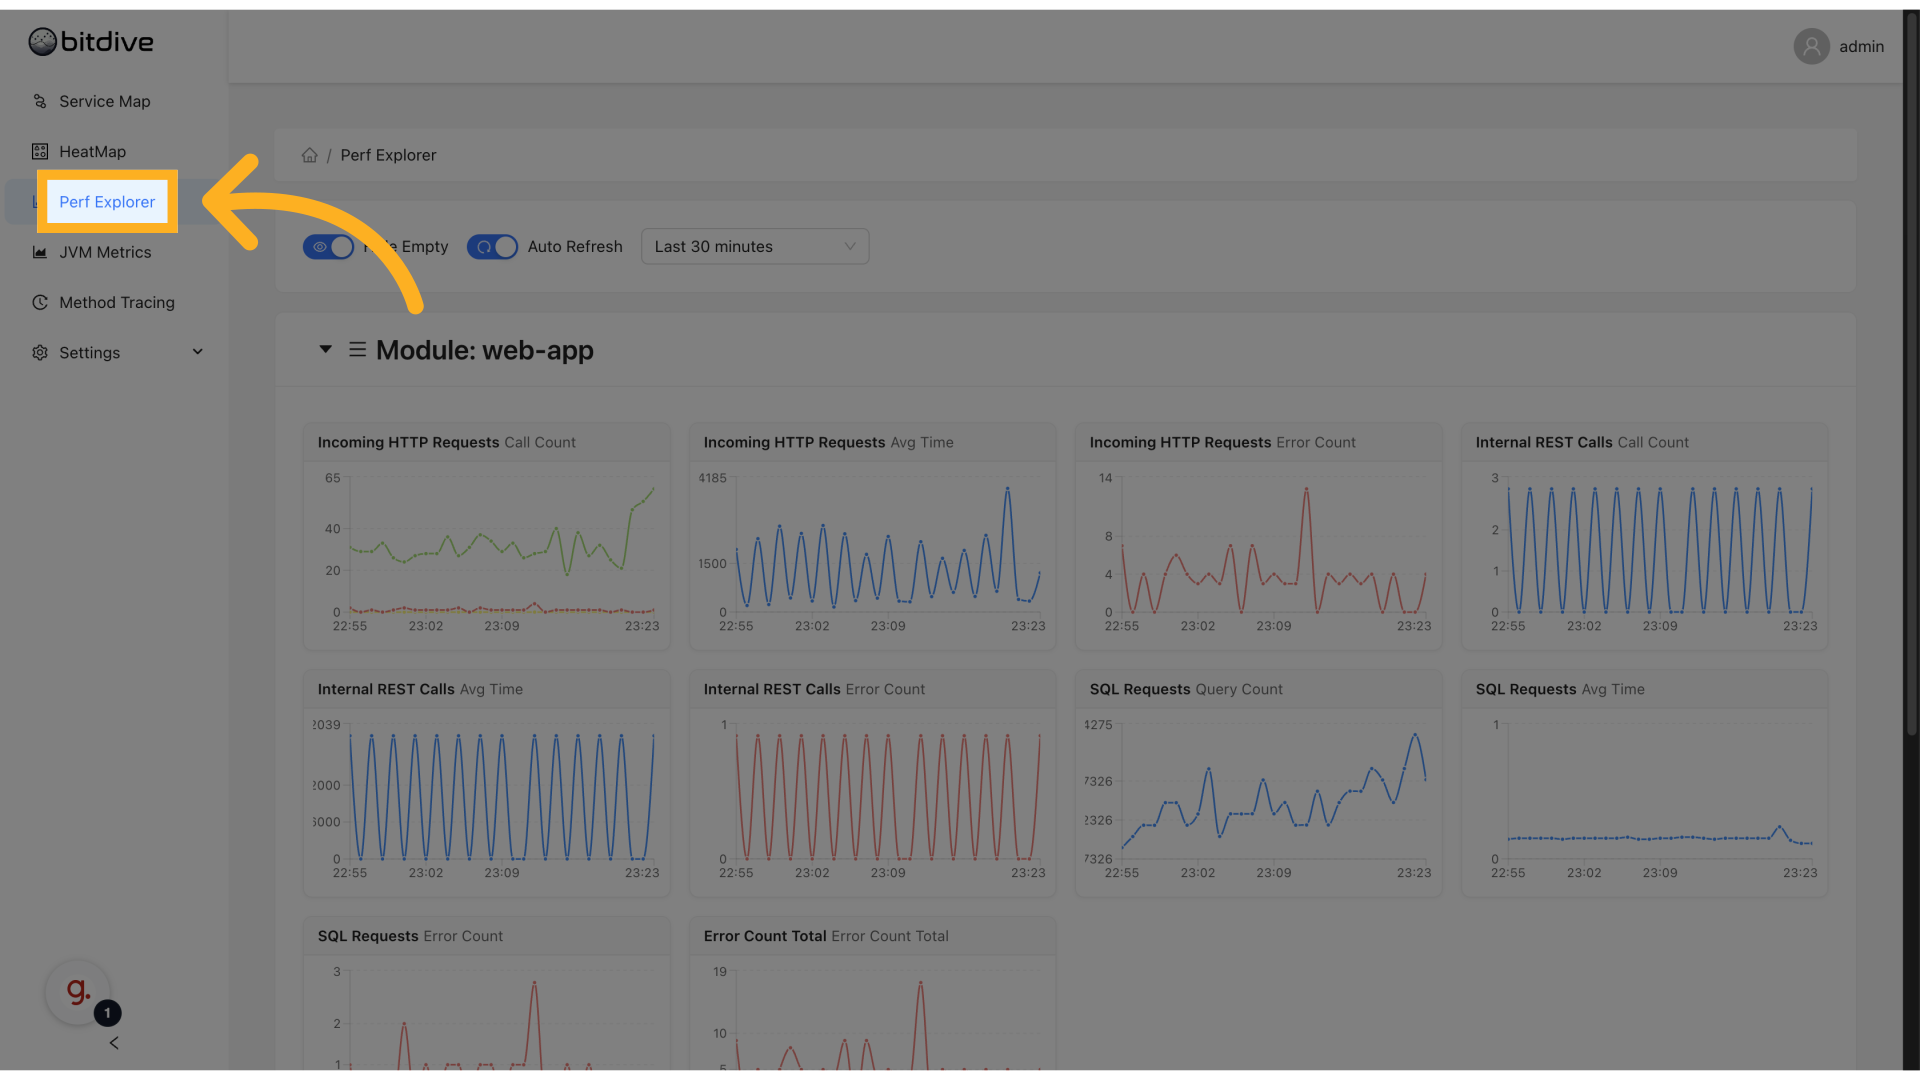
To begin using Performance Explorer:
- Open the BitDive web console.
- Click on Perf Explorer in the left-hand navigation bar.
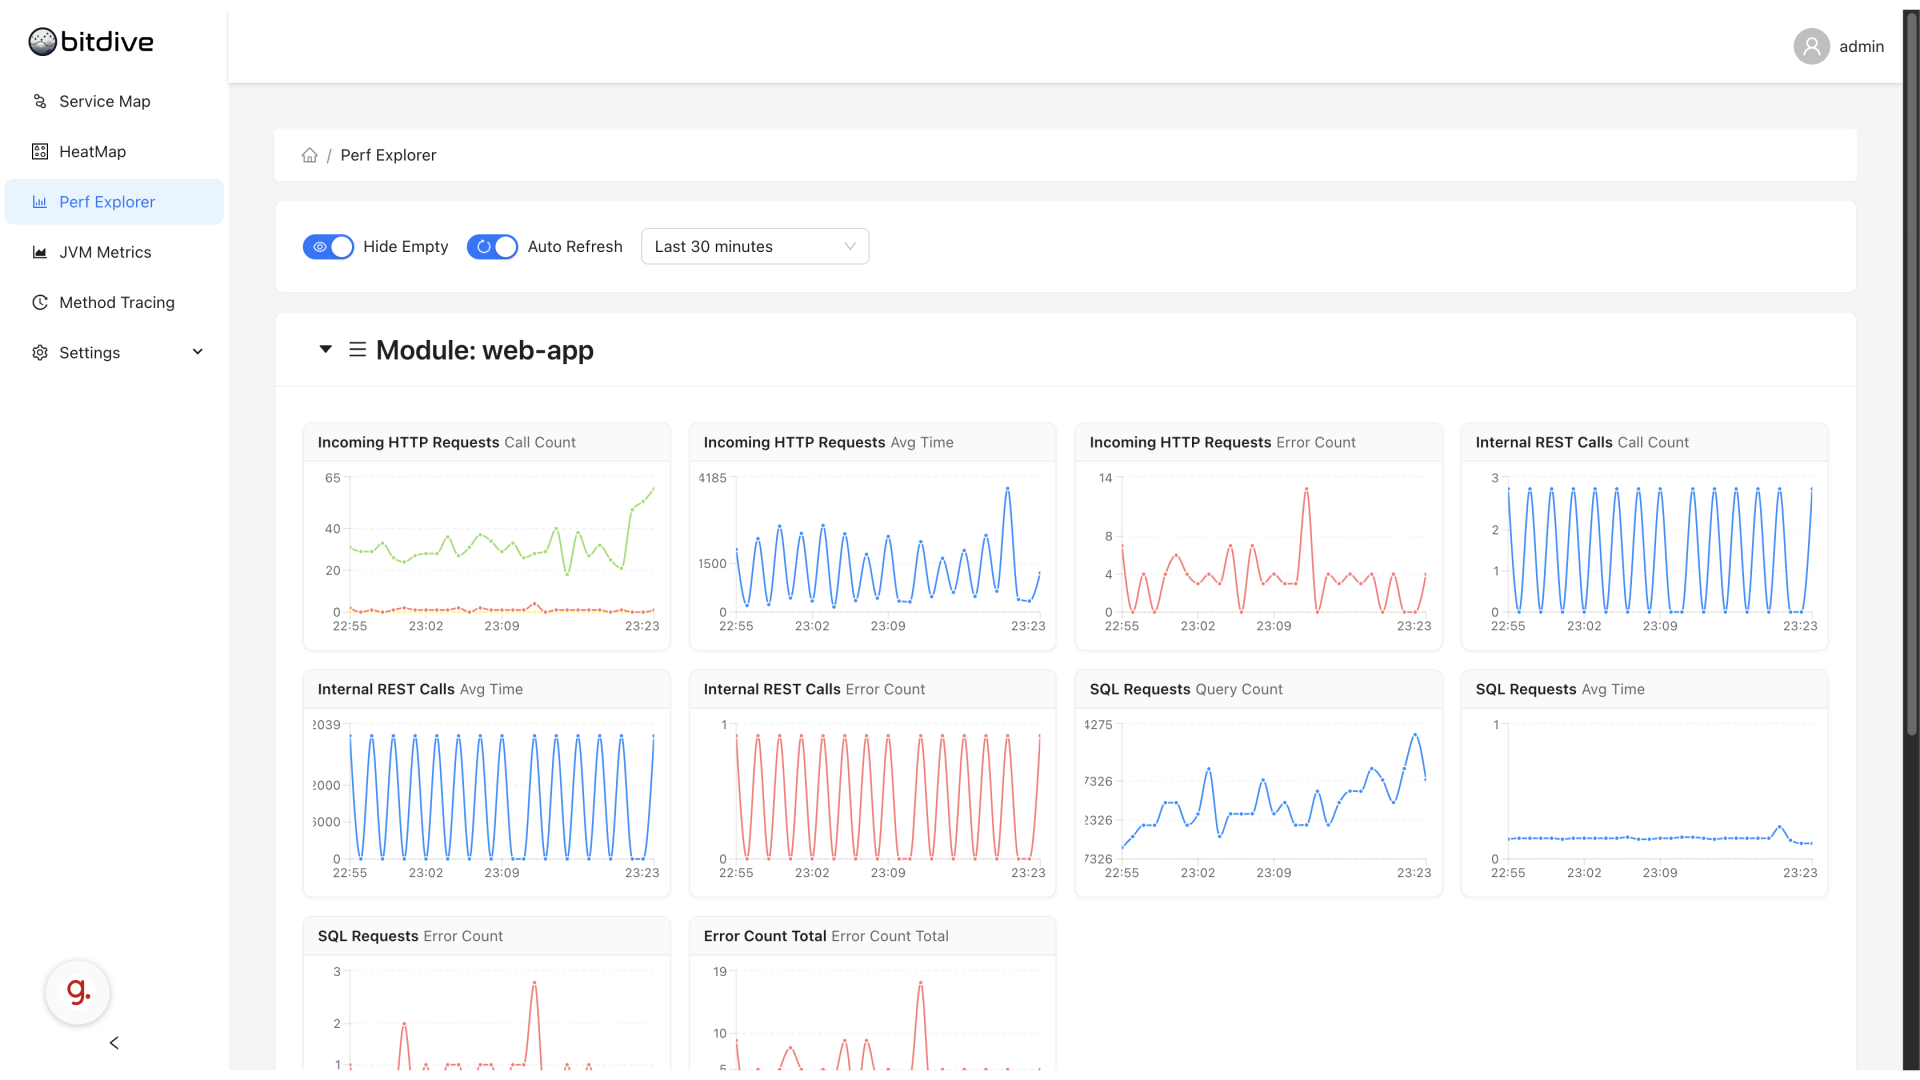
You will see an interactive metrics dashboard that visualizes JVM-level statistics over time using easy-to-read charts.
Understanding the Metrics
Performance Explorer provides the same metrics that are visible in HeatMap, but displayed as time-series graphs. This view allows you to monitor trends, spot anomalies, and correlate data with incidents or releases.
Metrics available:
- Incoming HTTP Requests
- Call Count
- Average Time
- Error Count
- Internal REST Calls
- Call Count
- Average Time
- Error Count
- SQL Requests
- Query Count
- Average Time
- Error Count
- Scheduler Calls
- Execution Count
- Average Time
- Queue Send
- Send Count
- Average Time
- Error Count
- Queue Consumer
- Consumer Count
- Average Time
- Error Count
- Error Count Total
- Aggregated error count across all types
Each of these metrics is visualized as a separate graph.
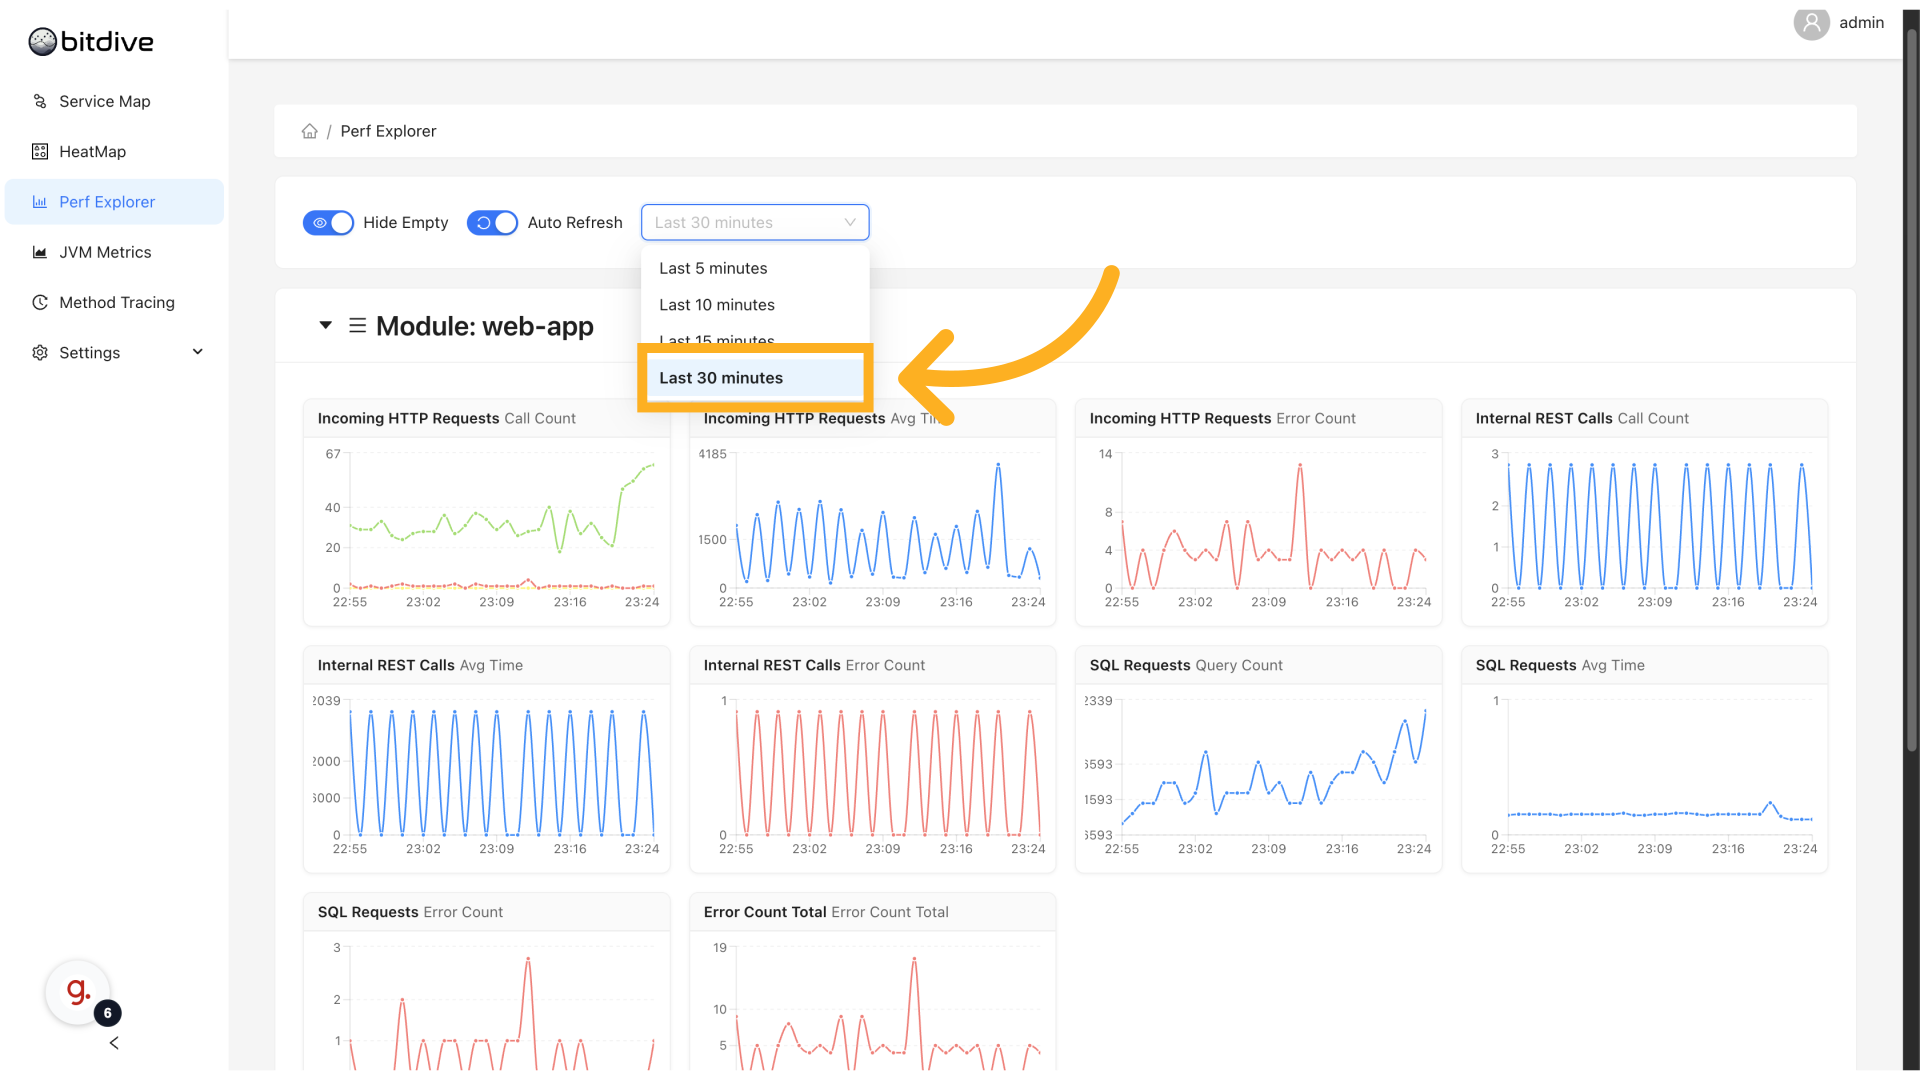
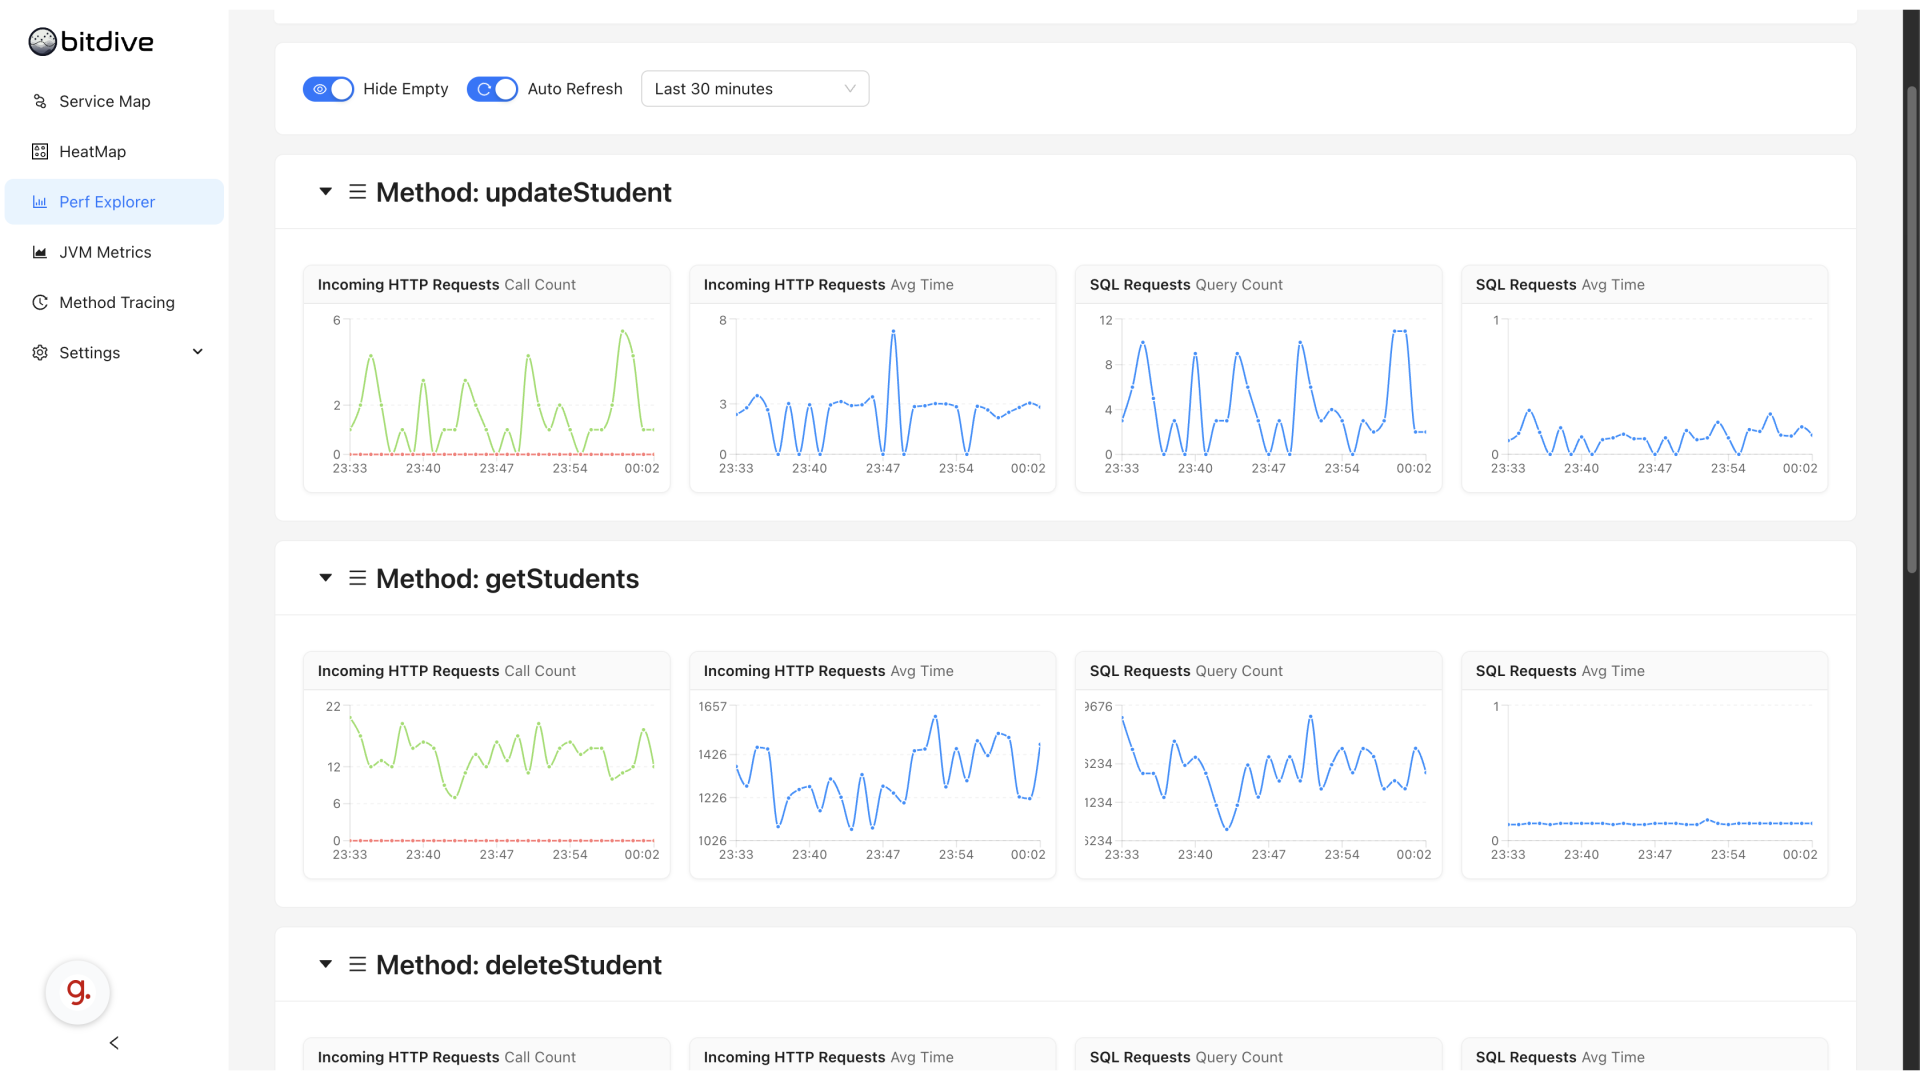
Time Range and Live Monitoring
Performance Explorer provides flexible controls to work with both historical and real-time data:
- Time Range Selector → Choose between Last 5 minutes, Last 30 minutes, Last hour, or custom ranges.
- Auto Refresh Toggle → Enable live mode to keep graphs updating automatically.
This makes it equally useful during incidents, debugging sessions, or after action reviews.
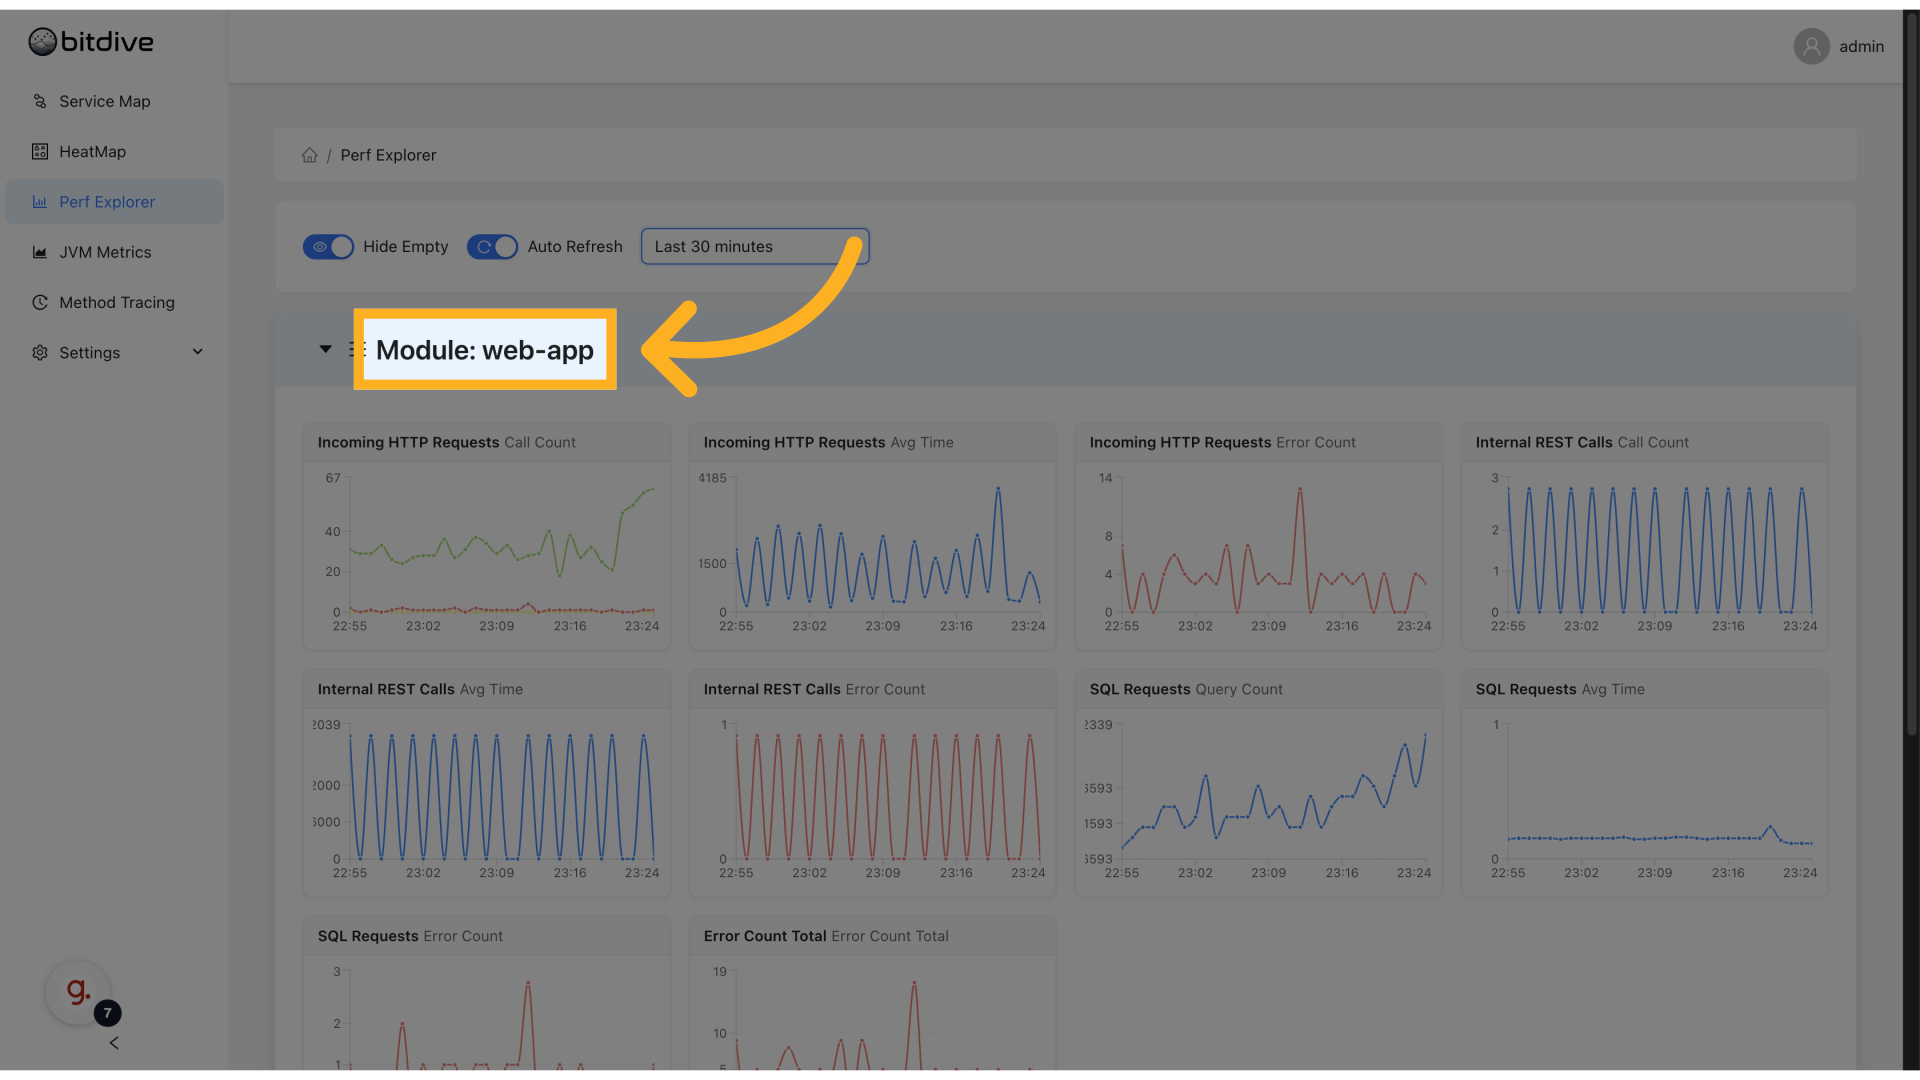
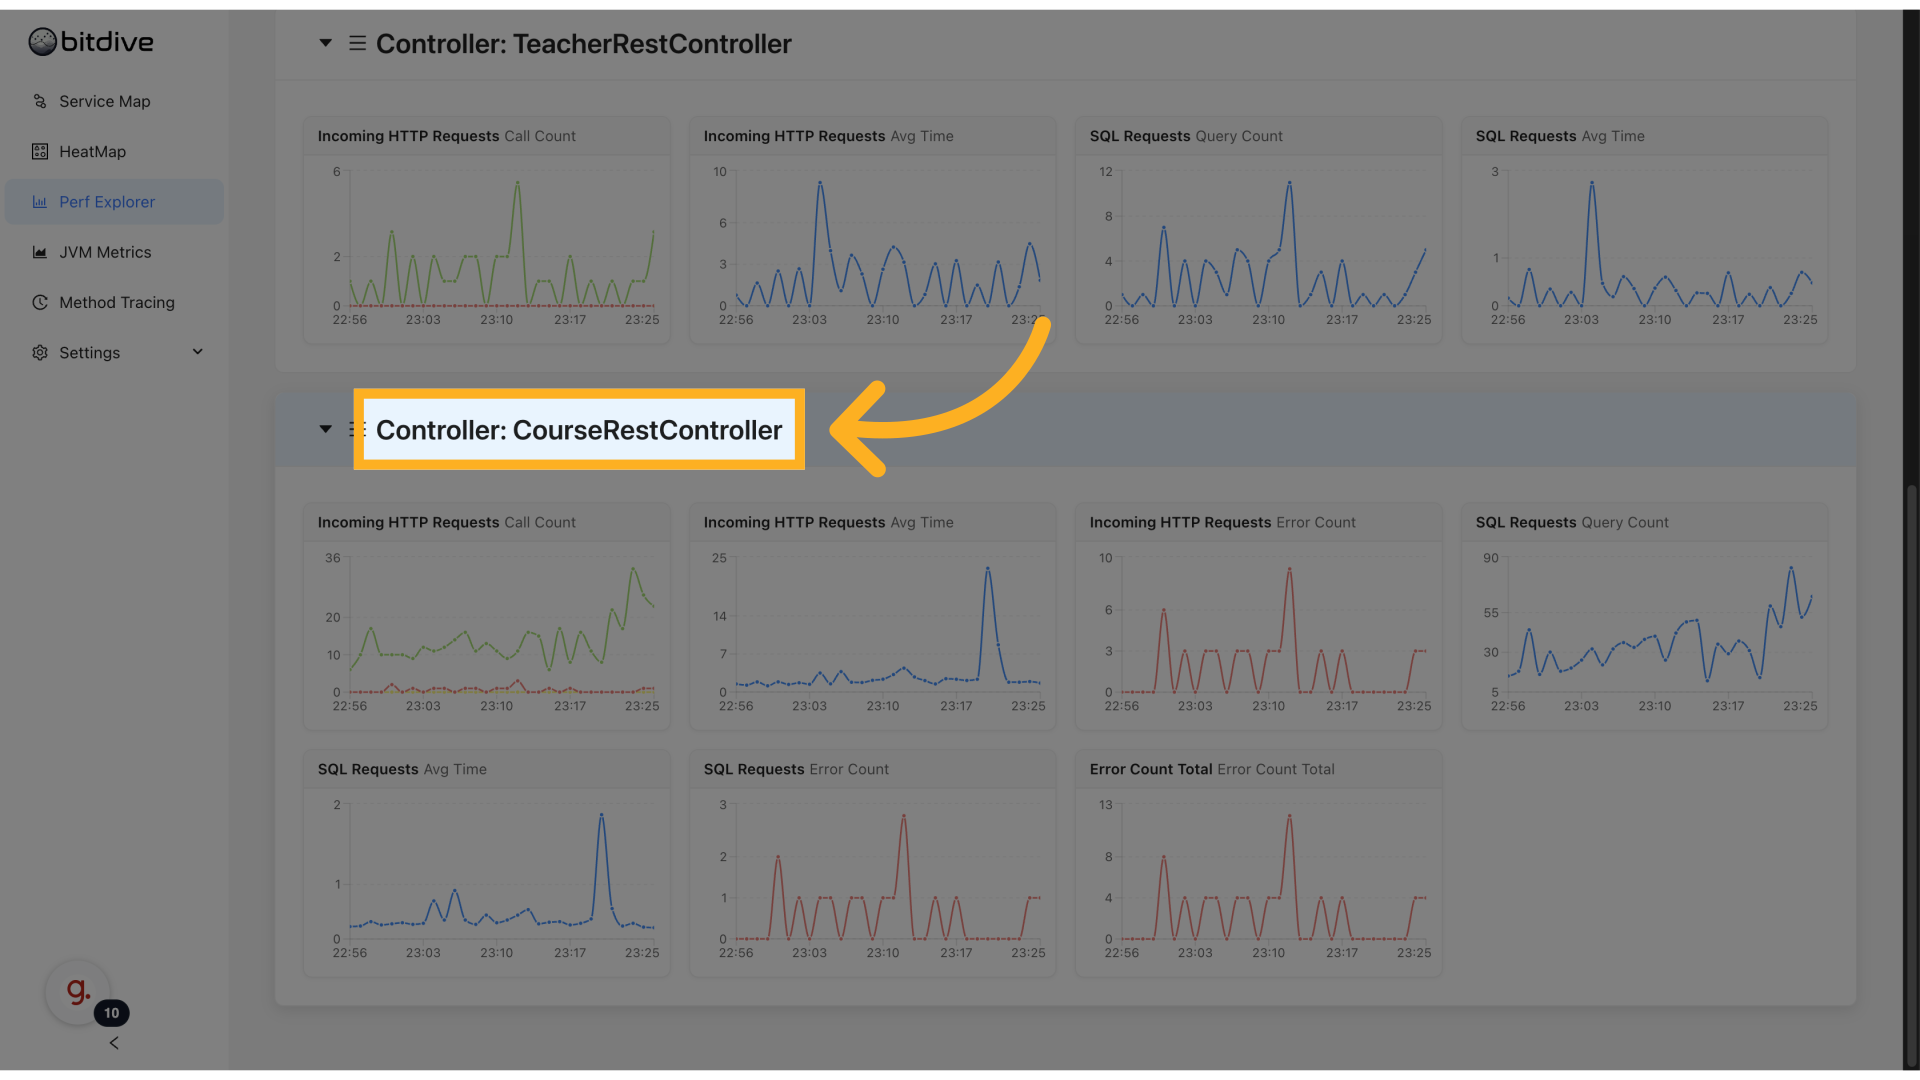
Drilldown: Module → Class → Method
Performance Explorer supports hierarchical navigation to help you zoom into issues step-by-step:
Module Level
Aggregated view of metrics across major parts of your system.
- See which application modules have the highest load or error rates.
Class Level
Shows metrics grouped by classes within a module.
- Identify which classes are under heavy load or showing anomalies.
Method Level
Provides detailed metrics per method.
- Detect methods with high execution time or frequent errors.
- Understand what parts of your code contribute most to latency and load.
Use Cases
Performance Explorer can be used to:
- Identify performance hotspots
- Analyze code paths that cause latency or resource waste
- Monitor trends before, during, and after deployments
- Correlate performance regressions with incidents
- Provide evidence and context during root cause analysis
Relation to HeatMap
Performance Explorer and HeatMap use the same underlying JVM metrics. However, they are designed for different analysis scenarios:
| Feature | HeatMap | Performance Explorer |
|---|---|---|
| Visual Type | Color-coded cells | Time-series graphs |
| Best For | Spotting anomalies instantly across many methods | Investigating time trends and regressions |
| Level of Detail | Overview of all services at once | Detailed view per module/class/method |
| Use Case | What is slow right now? | When and how did this become slow? |
Best practice:
- Start in HeatMap to detect which methods or services are showing anomalies.
- Switch to Performance Explorer to analyze how their behavior evolved over time.
This combination gives you full-stack observability, from distributed service chains down to specific code methods.
Engineering Insight How BitDive Modification to Flame Graphs Enables Deterministic Testing
Summary
BitDive Performance Explorer delivers deep observability into JVM metrics at every level:
- Uniform set of actionable metrics across modules, classes, and methods
- Easy navigation and drilldown from global view to method-level analysis
- Real-time and historical views for both live troubleshooting and retrospective analysis
- Integrated with HeatMap and Service Map for unified observability
With Performance Explorer, performance engineers, developers, and SREs can continuously profile and optimize their Java applications - ensuring better reliability, scalability, and user experience.