BitDive Method Tracing
Overview
Method Tracing in BitDive offers the deepest level of observability into your distributed applications. It allows you to see every single method call and trace how requests flow not only within a microservice but also between them.
Unlike typical tracing tools that stop at service or span level, BitDive lets you explore method chains with input/output parameters, error statuses, timings and cross-service context.
Accessing Method Tracing
There are three ways to get into Method Tracing:
- From the Sidebar Menu
- Navigate to Method Tracing to select the desired method directly.
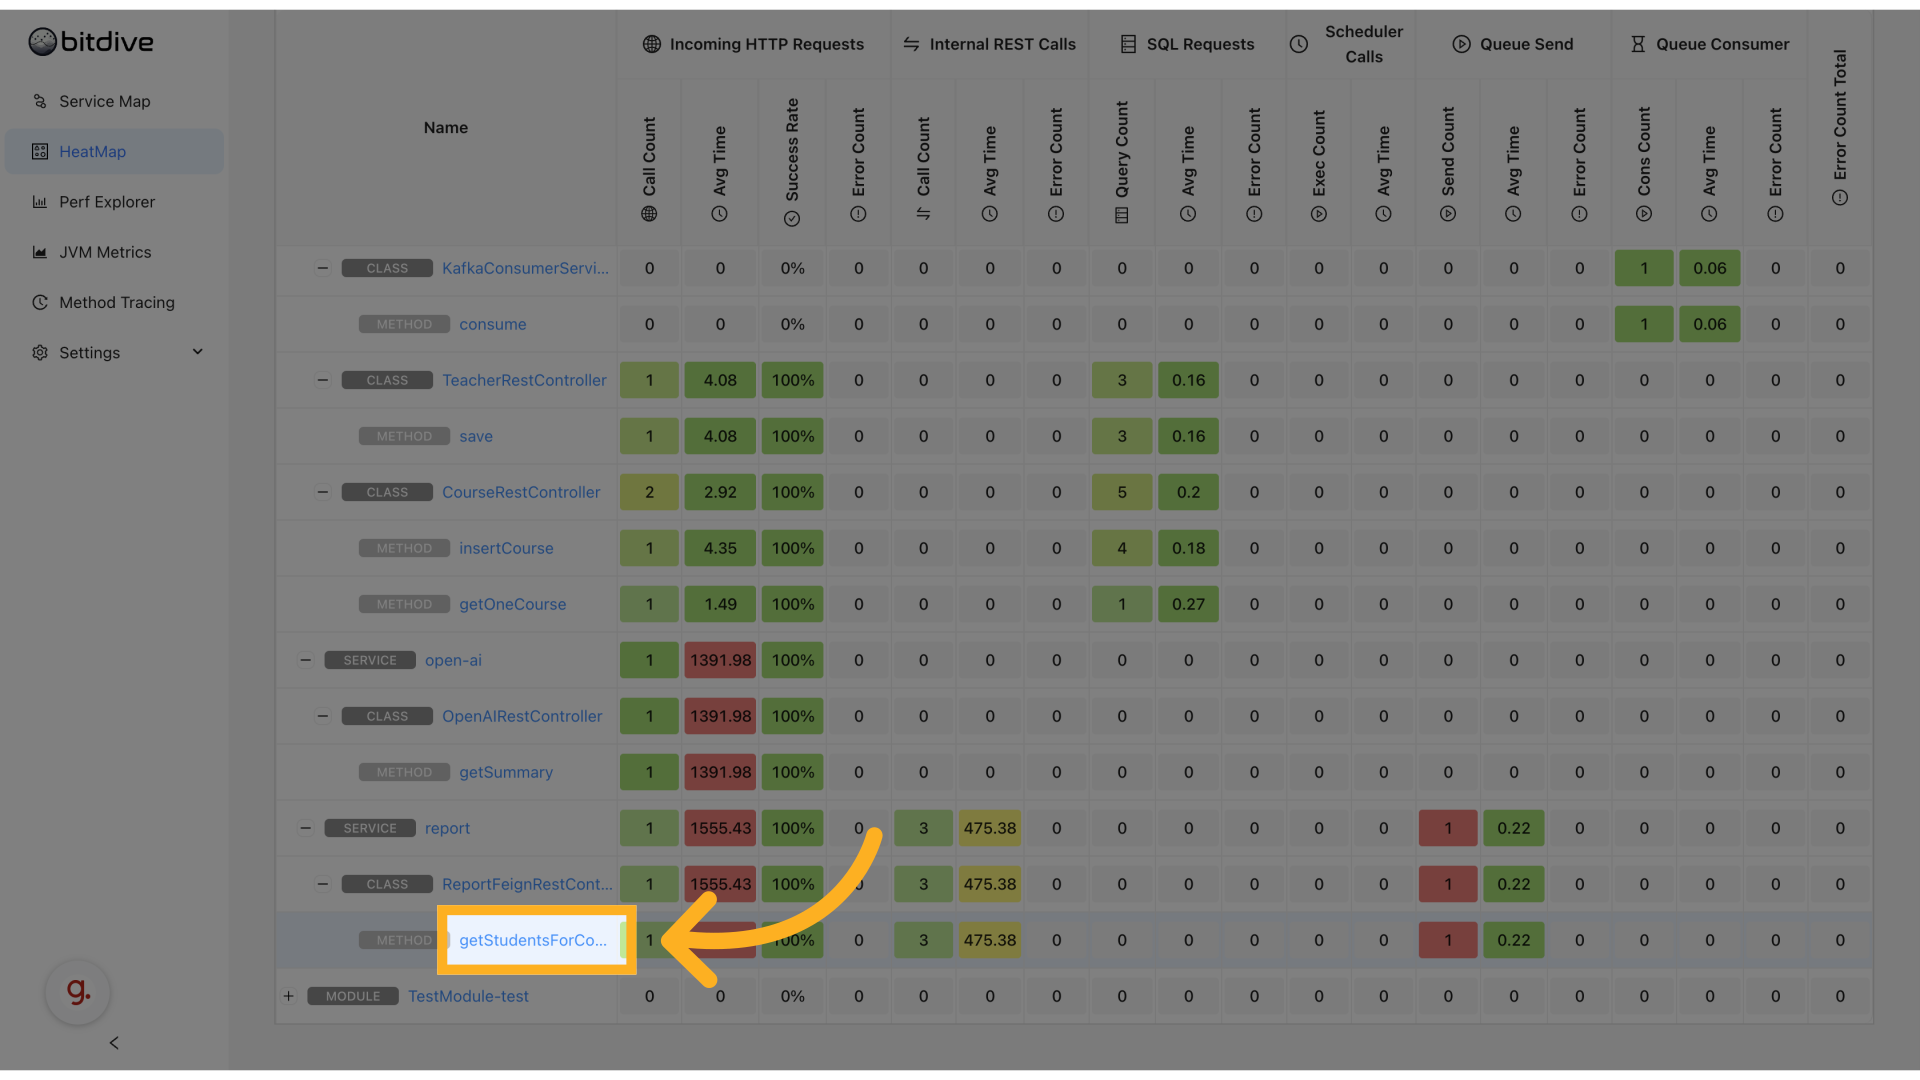
- Via HeatMap
- Click any method cell to jump directly to trace view.
- Via Performance Explorer
- Drill down into a method to access the trace view.
This makes Method Tracing tightly integrated into every analysis workflow.
Call Timeline View
The timeline view displays the sequential execution of methods, showing parallel operations and dependencies in a clear, time-based format:
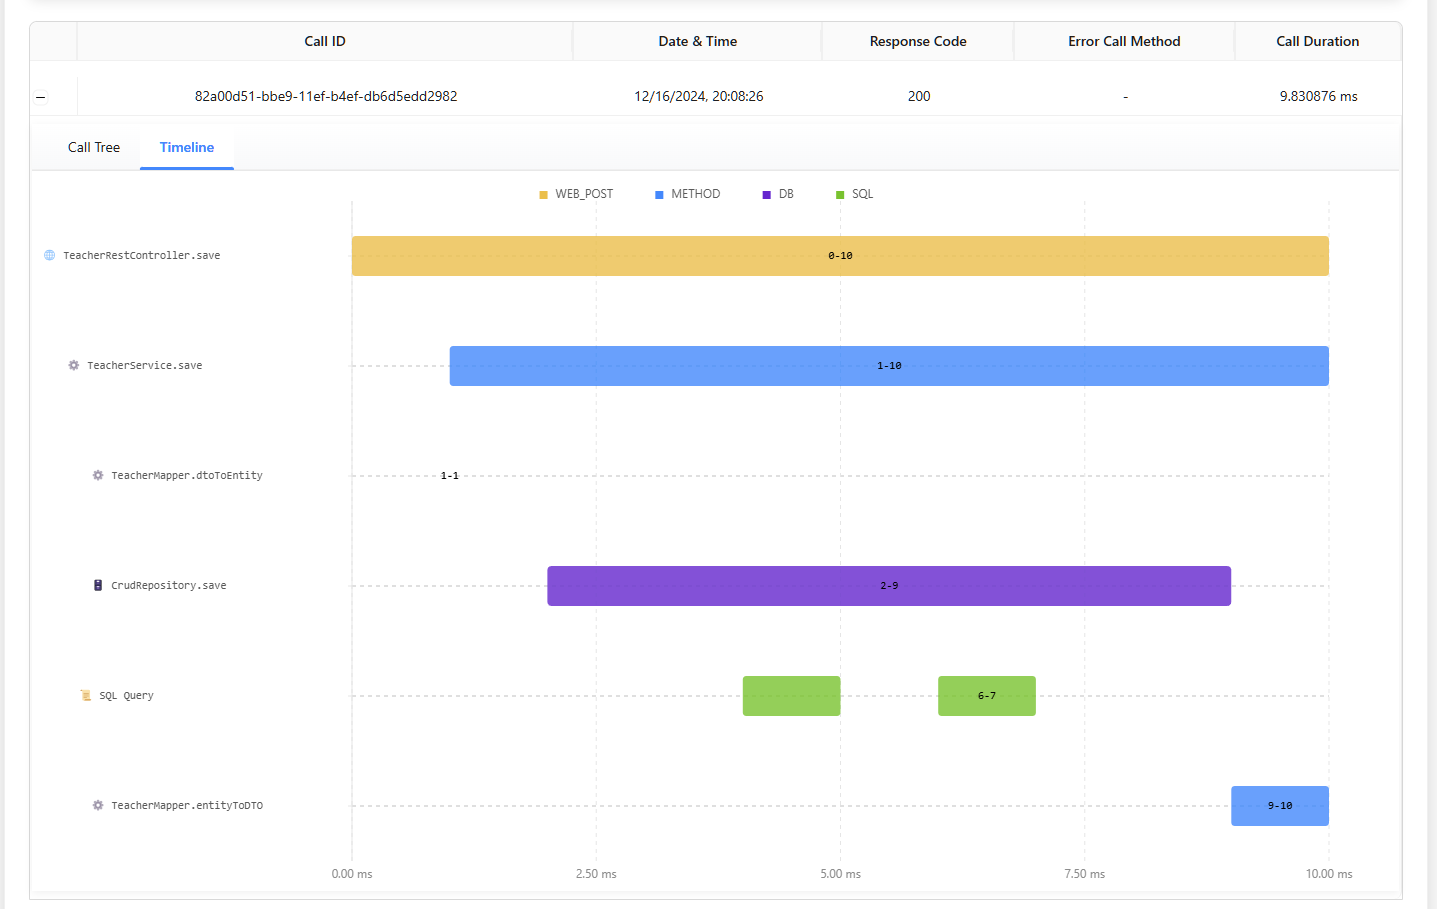
Key features include:
- Execution duration visualization
- Parallel operation tracking
- Method dependency mapping
- Operation type indicators (WEB_POST, METHOD, DB, SQL)
Full Call Chain View
See the complete chain of method calls across your distributed system:
Filtering Calls
At the top, you can filter calls with detailed criteria:
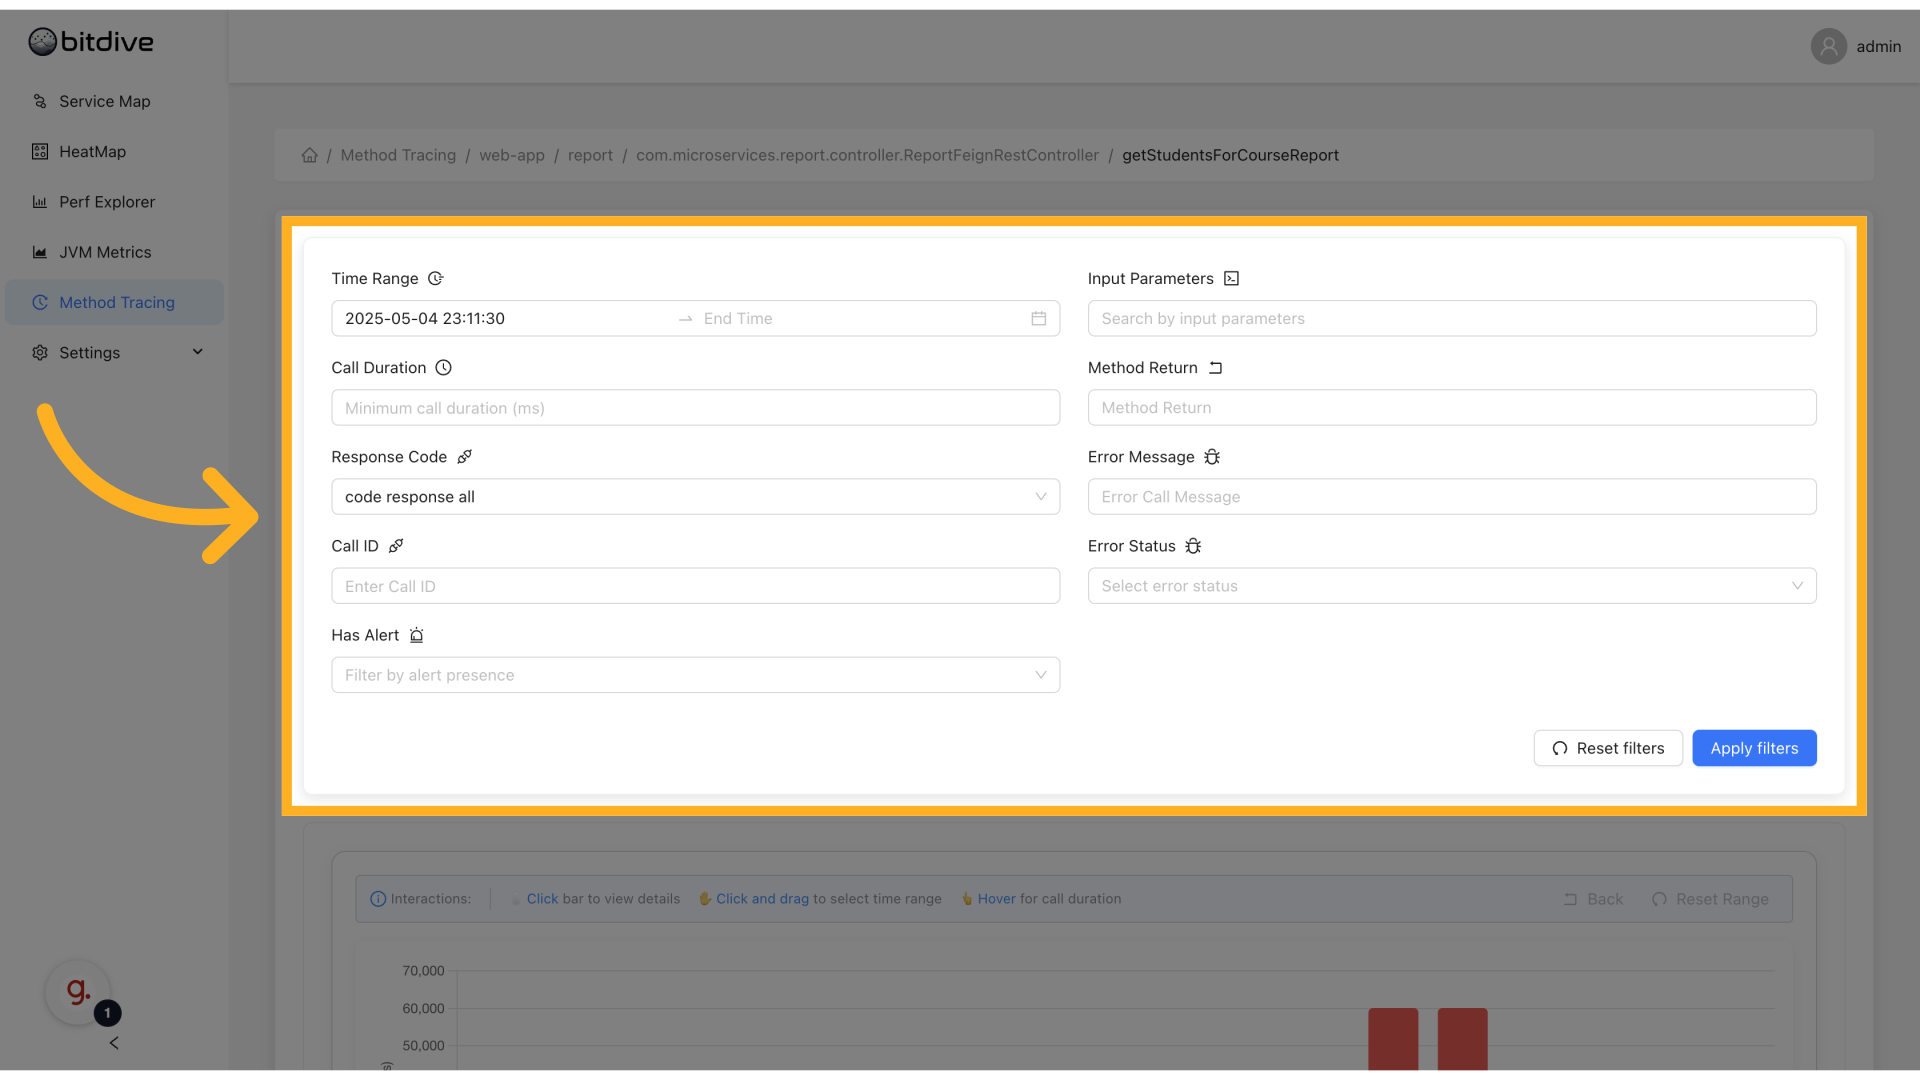
- Time Range - see calls only for a selected period
- Input Parameters - filter by specific method parameters
- Call Duration - find slow or fast calls
- Response Code and Return Value - focus on errors or specific outcomes
- Error Message and Error Status - isolate failed calls
- Has Alert - show calls linked to alerts
- Reset / Apply Filters - manage filter state
This helps when investigating errors, slow requests, or checking problematic input combinations.
Viewing Call History and Graph Interactions
Below the filters, you see Call History:
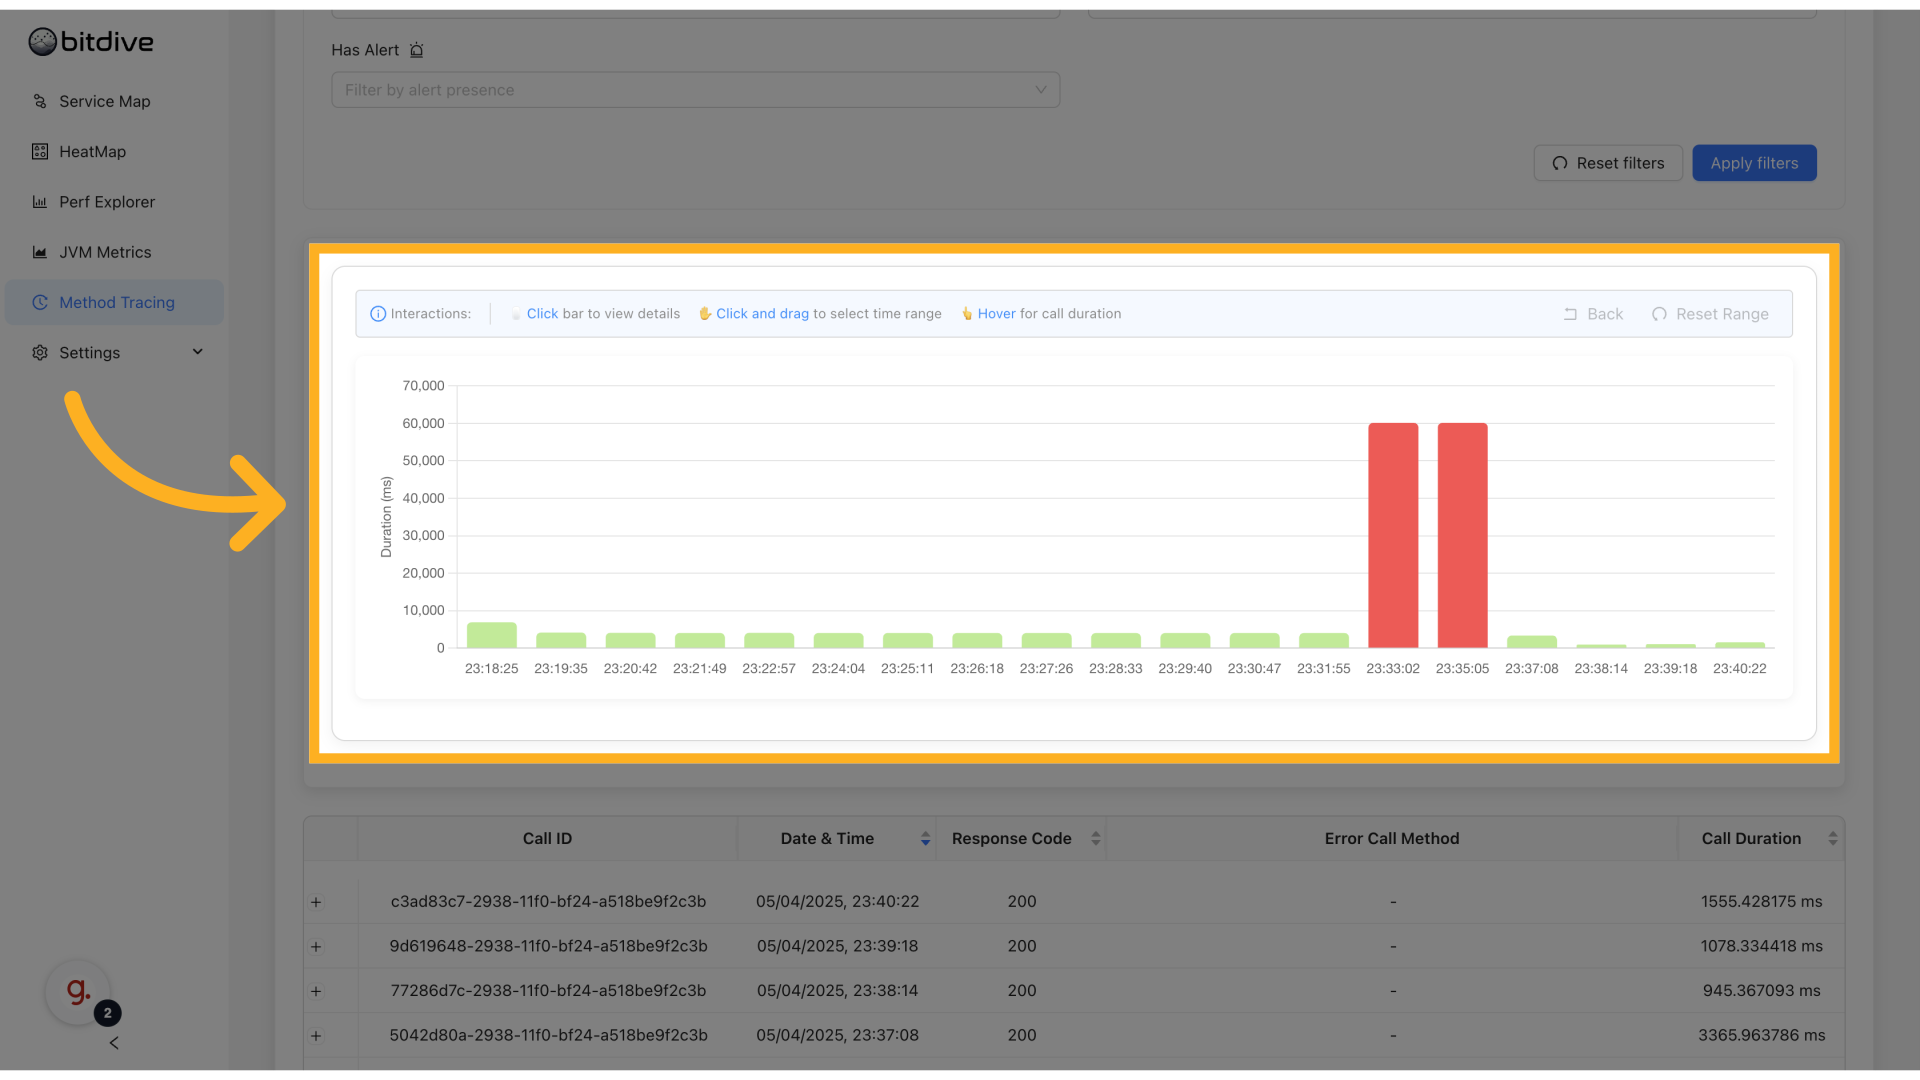
- List of all calls matching your filters
- Shows timestamp, input, duration, status
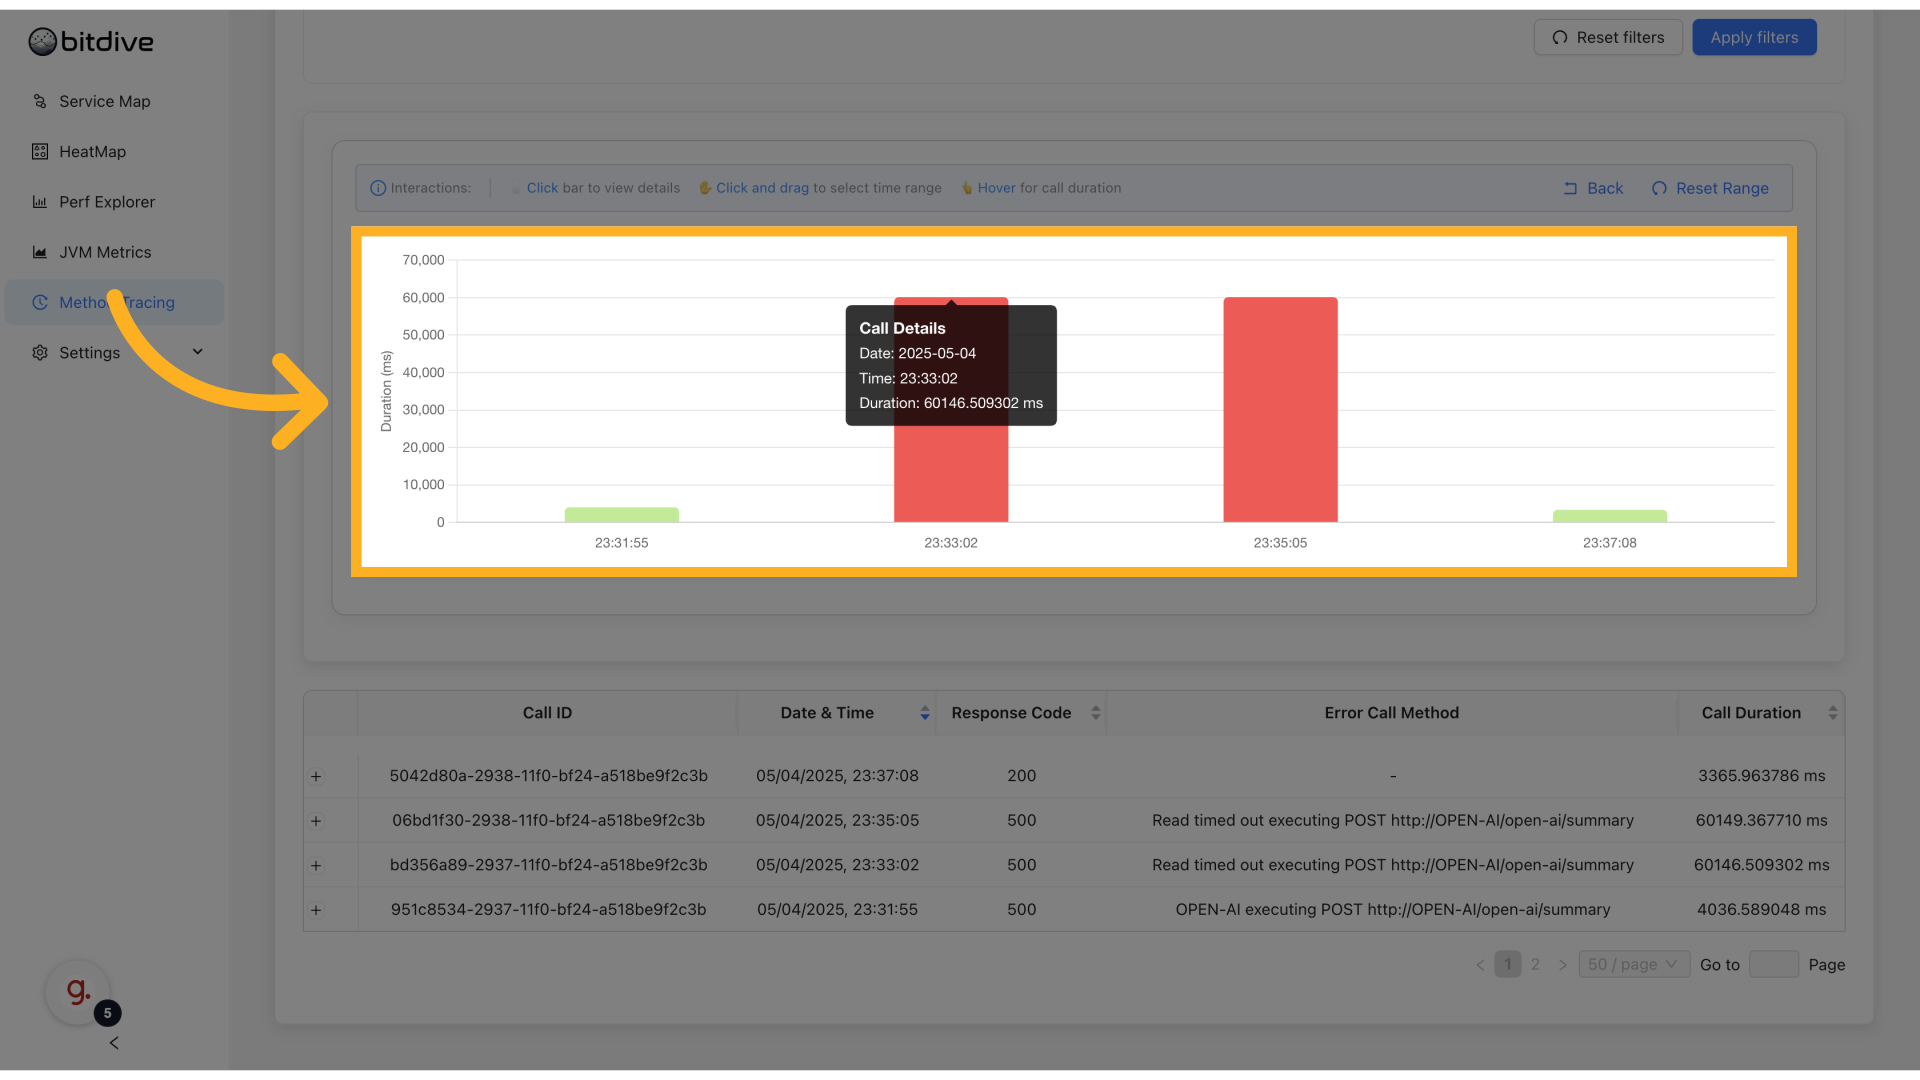
- Hover on timeline graph to see spikes
- Click and drag on graph to zoom into periods
You can easily zoom into traffic spikes or slow periods to understand what happened in detail.
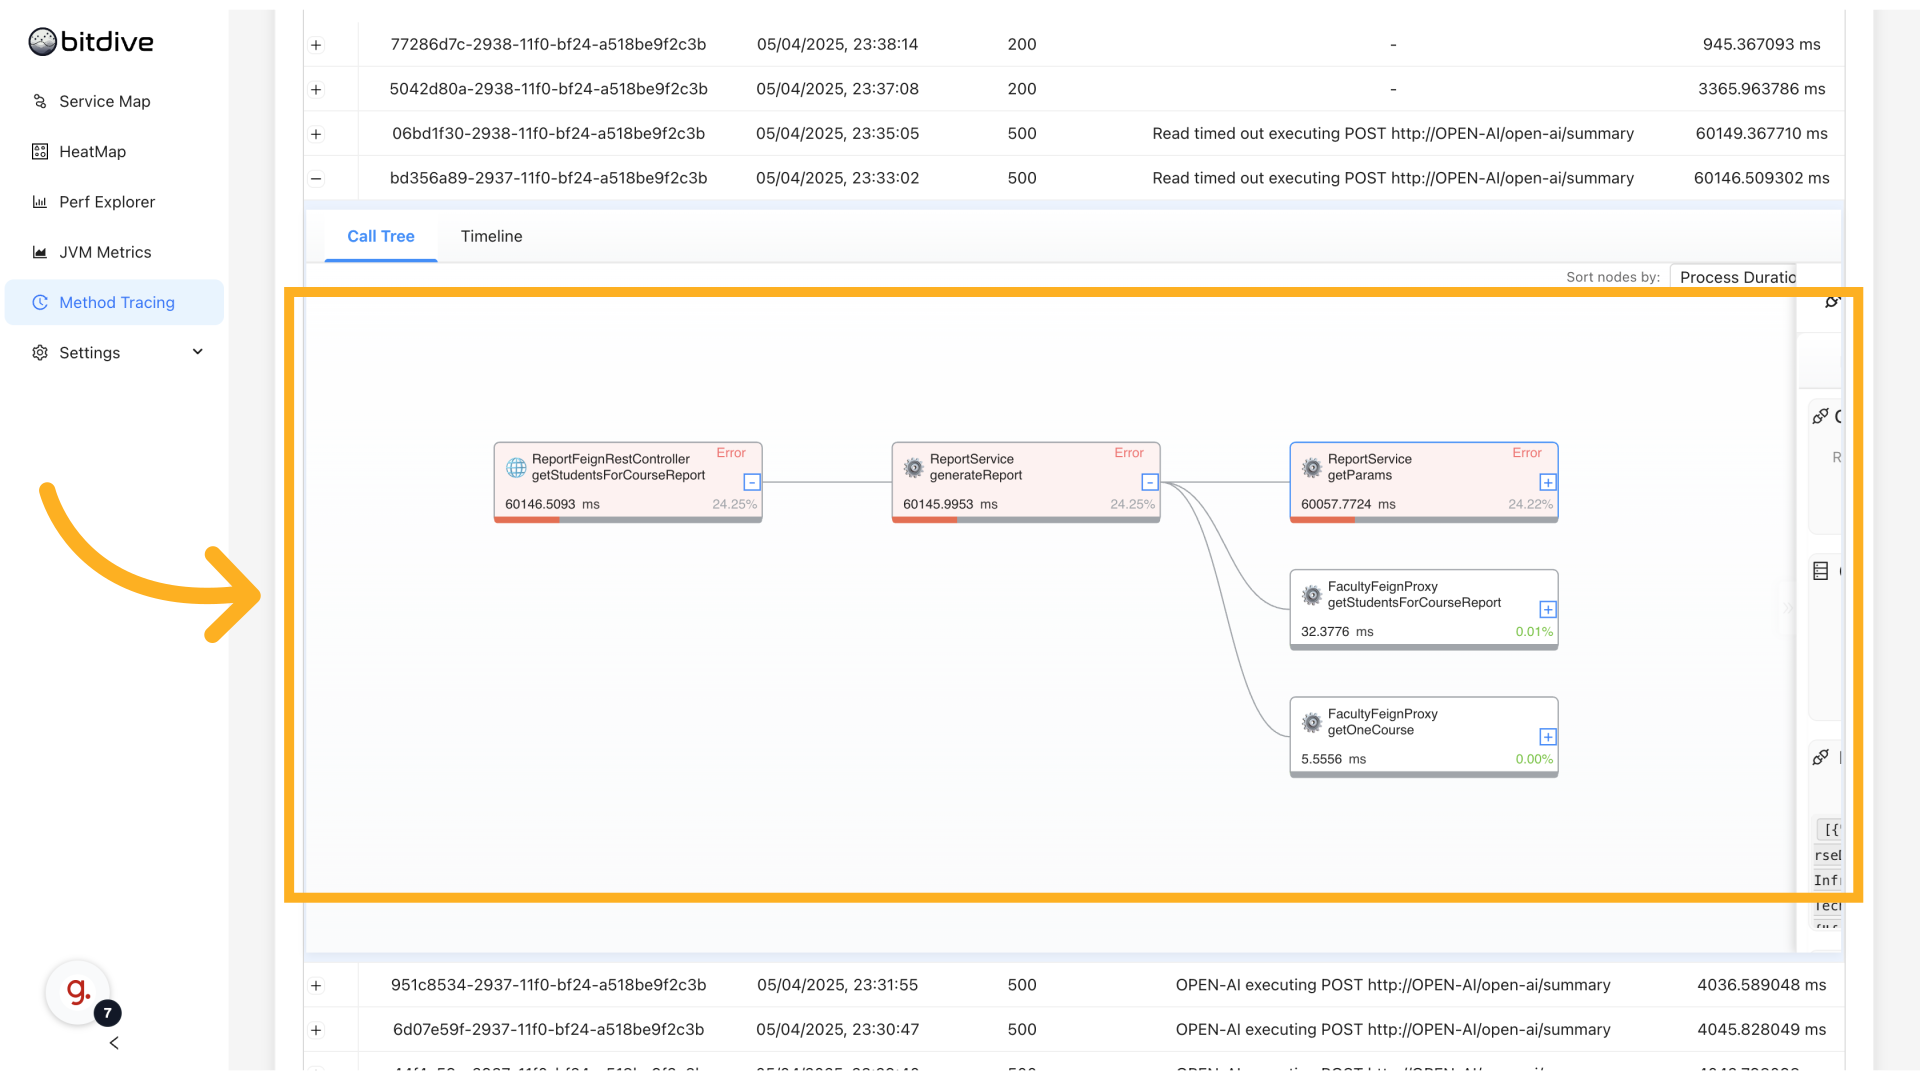
Full Call Chains View
Click on any call to open the Full Call Chain:
- Shows method calls inside service AND cross-service
- Expand/collapse nodes to drill into subcalls
- Shows timings and errors inline
- Focused only on user code - no noise from framework or system calls
This is the main view for finding slow parts, long chains, and failed dependencies.
Viewing Errors and Specific Call Details
When a call in the chain fails, click it to open details:
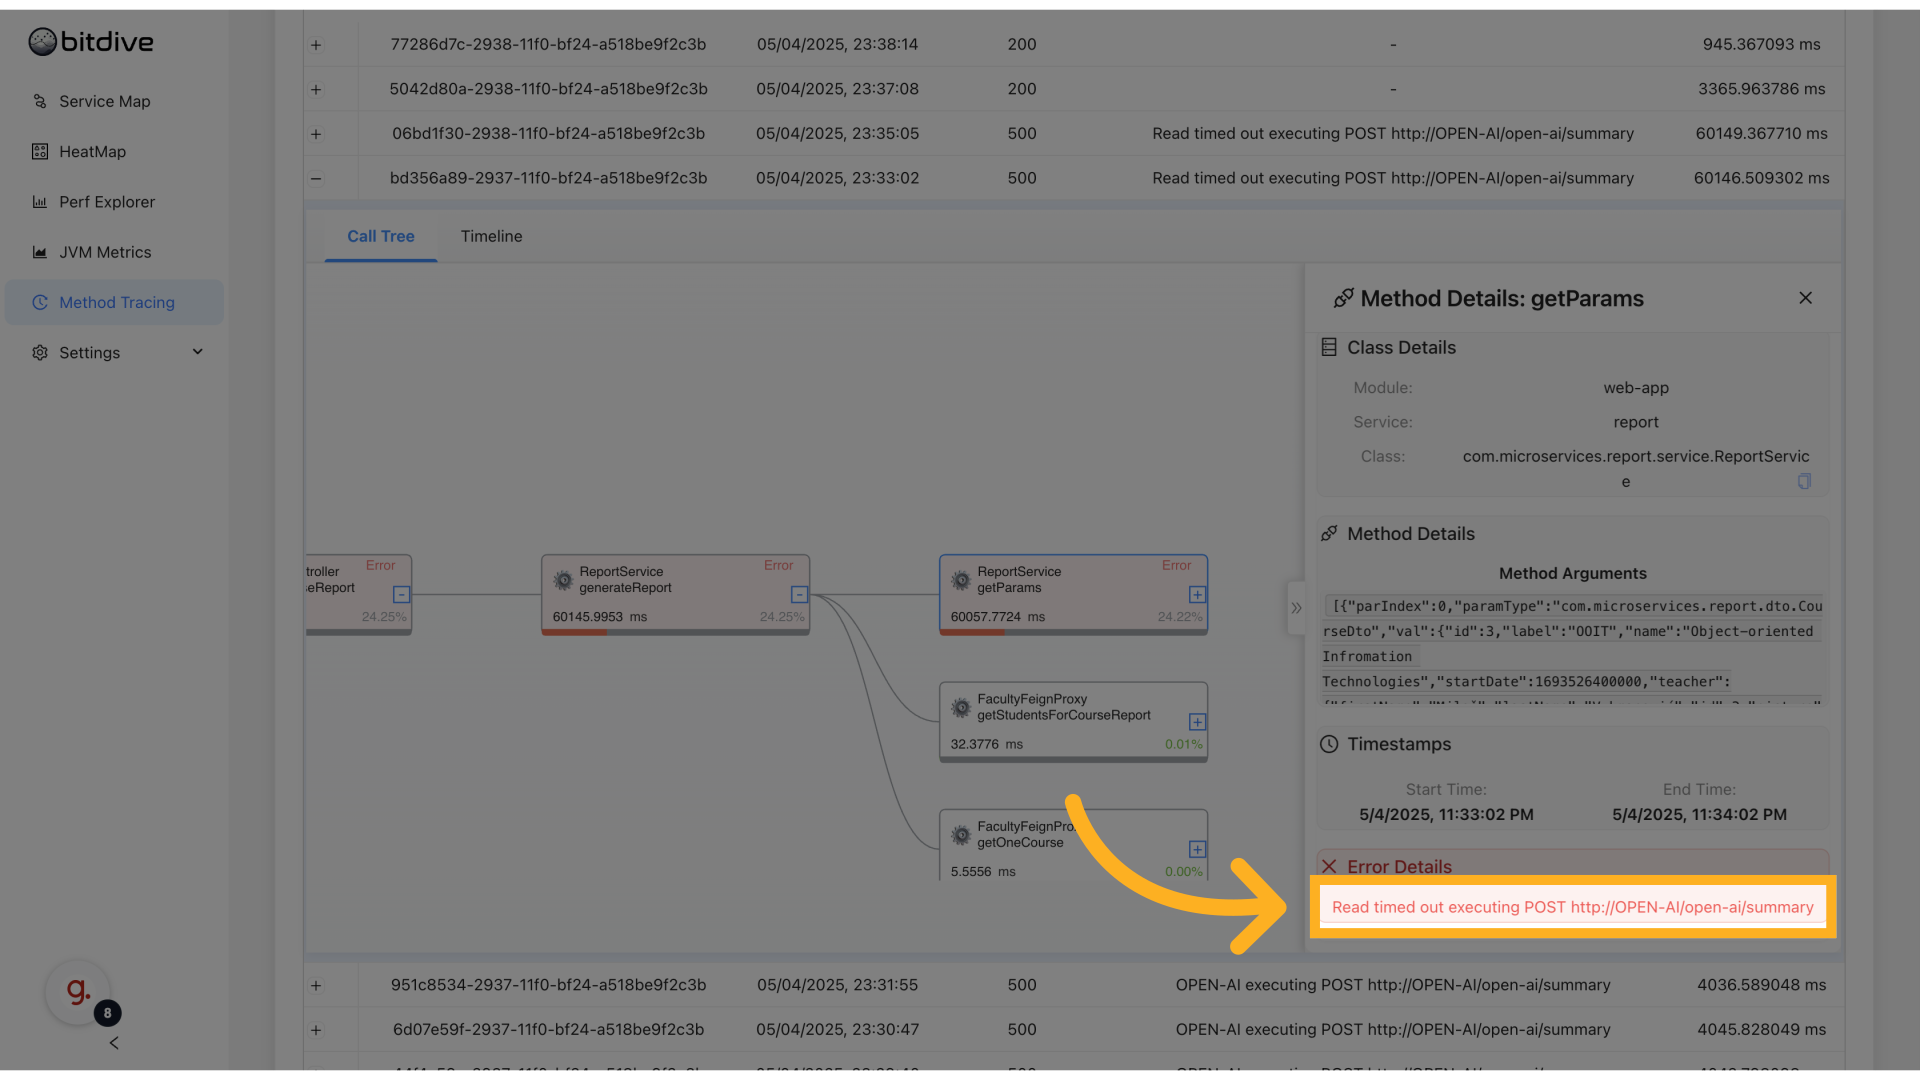
- Shows request parameters
- Full error text
- Duration
- Which method and microservice failed
This helps pinpoint where exactly request chain broke and why.
REST Calls and External Operations
REST calls and other external operations are visually marked:
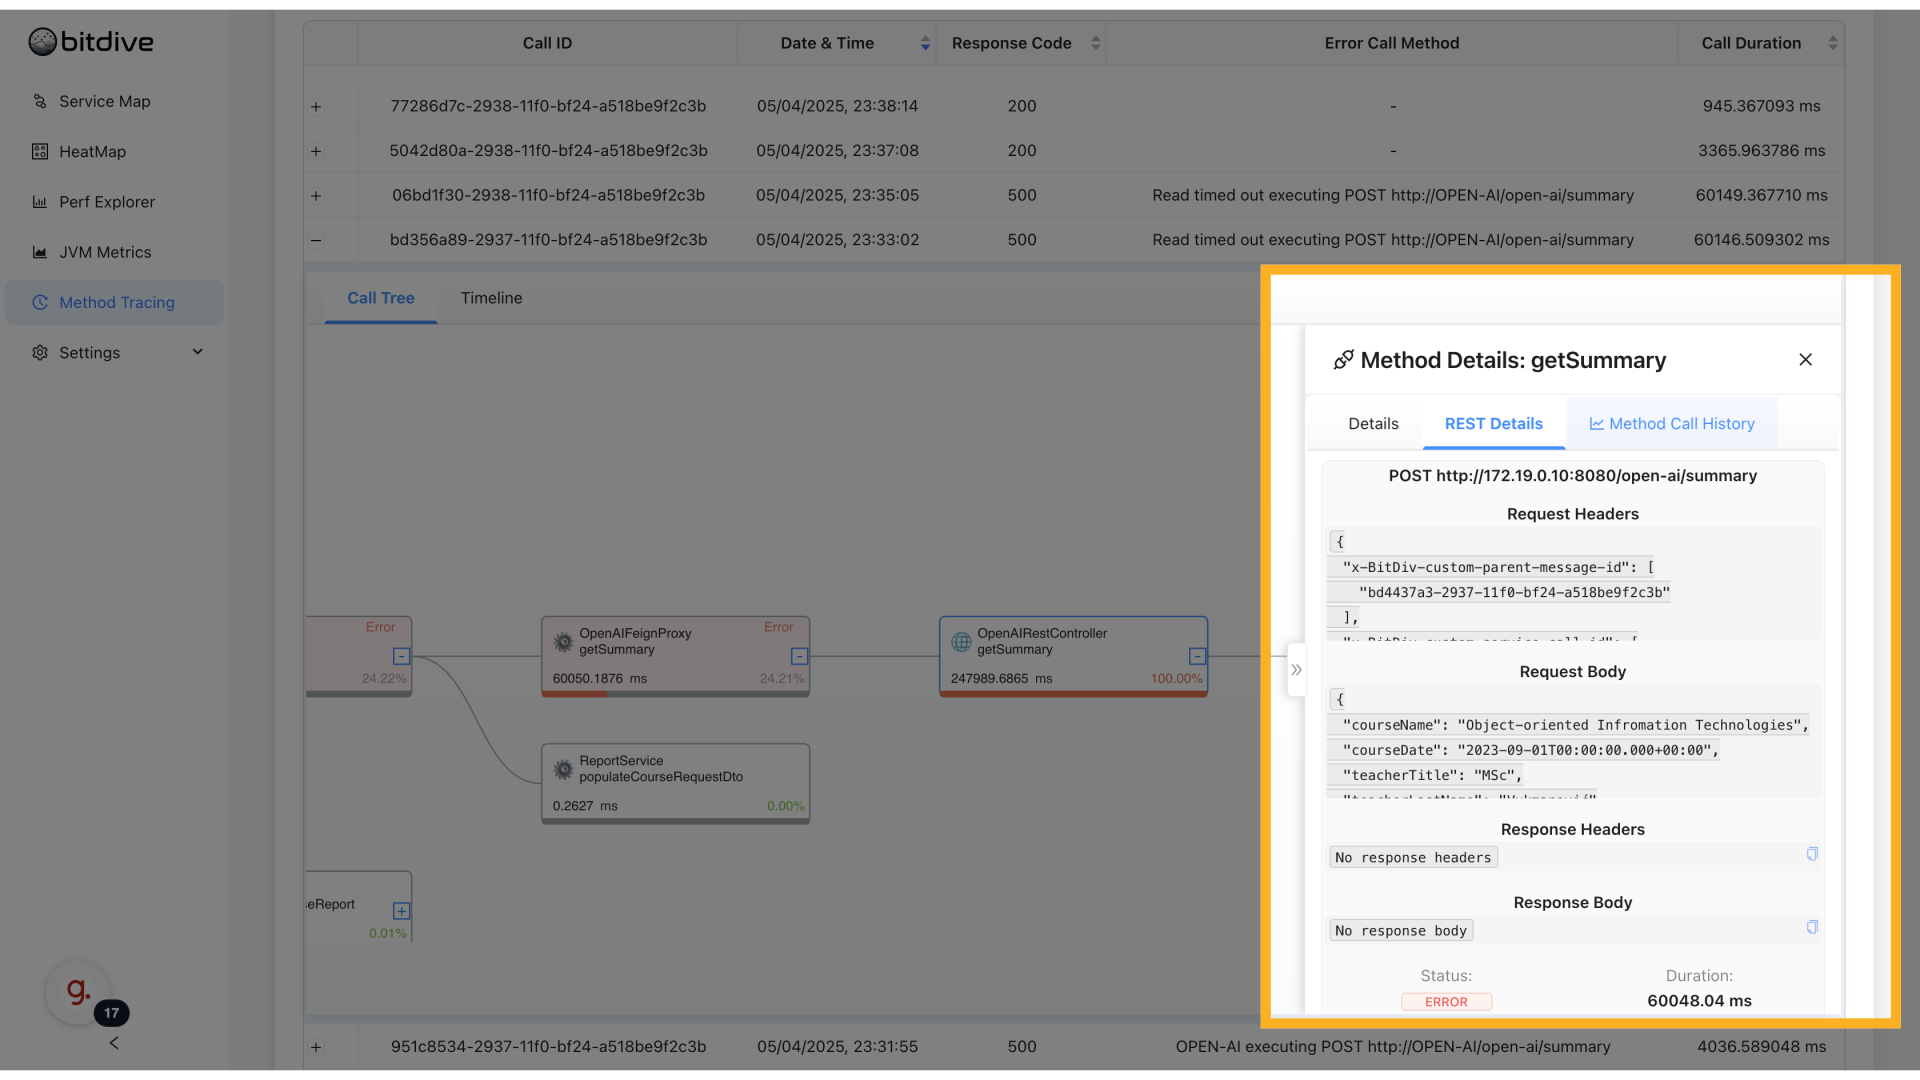
- Globe icon indicates external REST call
- Queue / SQL icons show other system integrations
- Click to see:
- HTTP method
- URL
- Response code
- Execution time
This helps investigate slow external dependencies and see REST error details.
Method Call History
For each method, use Method Call History tab:
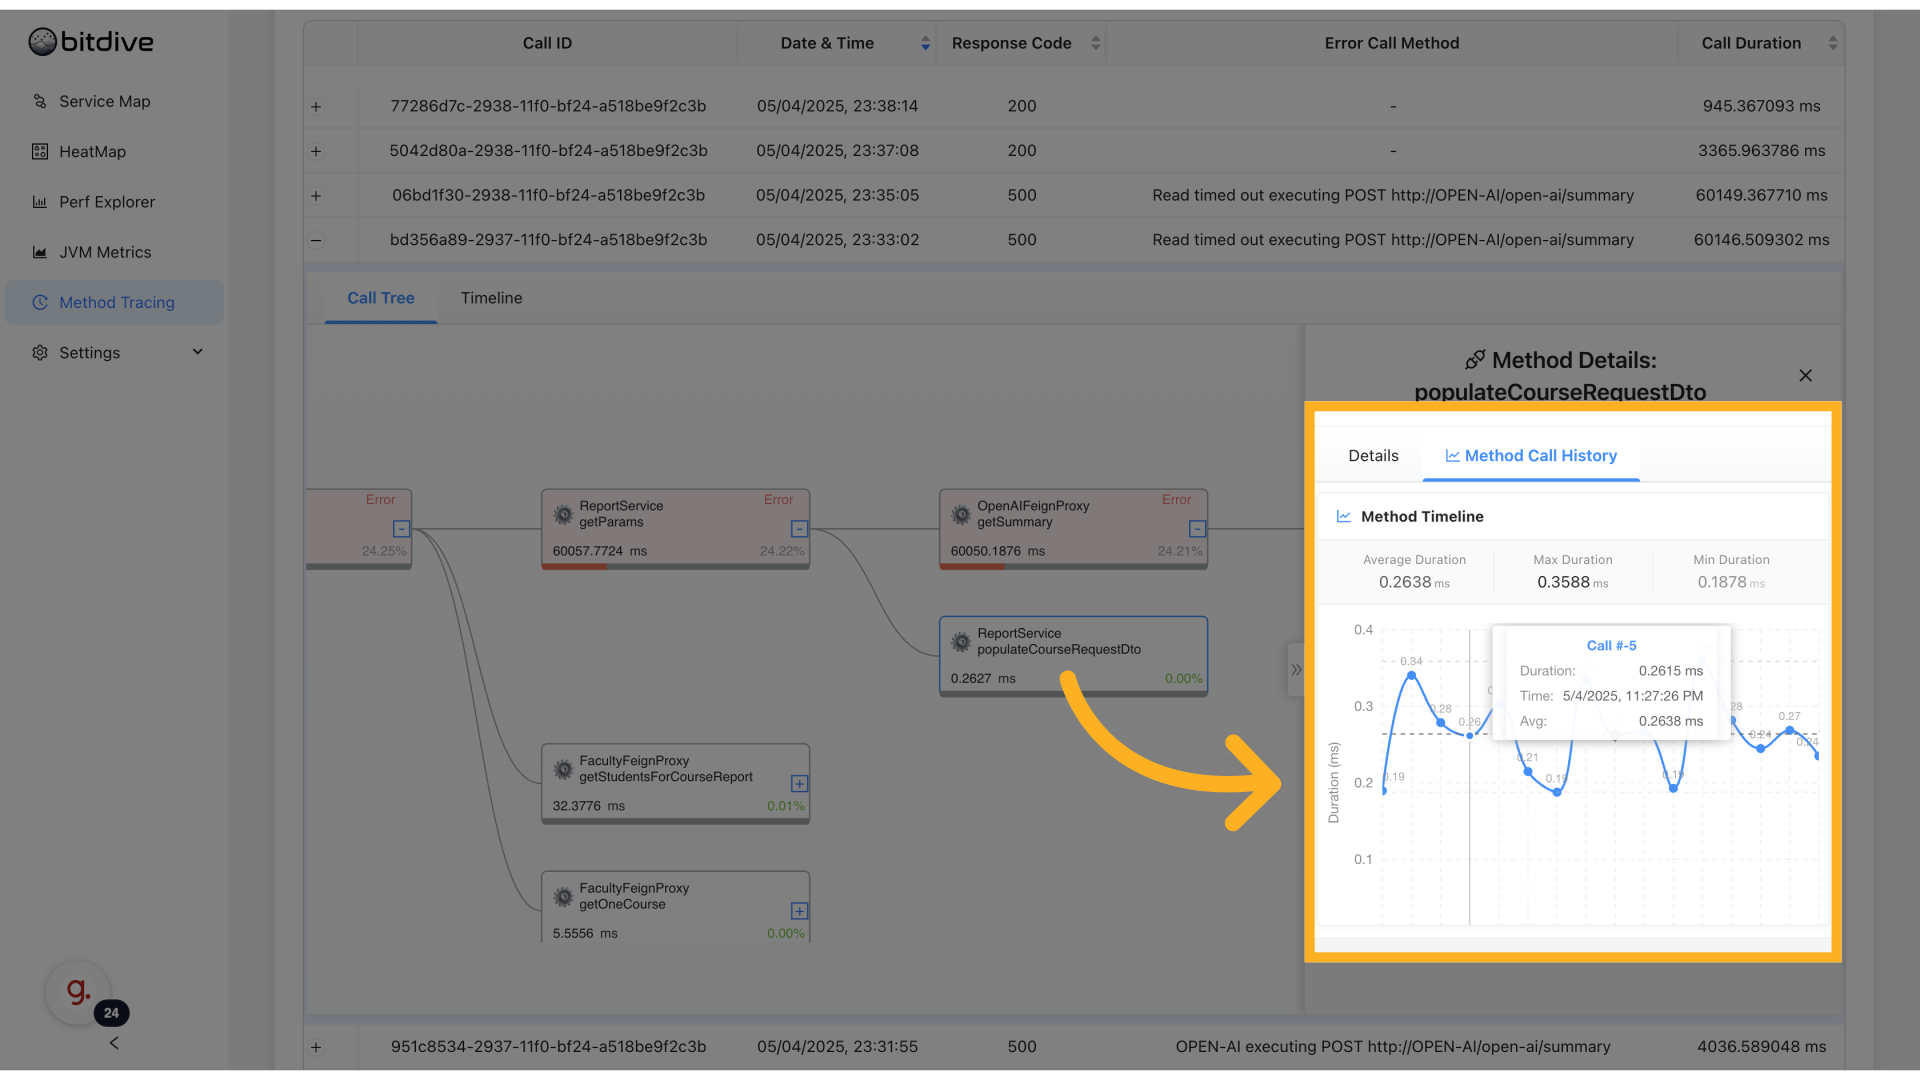
- See who called this method (parent trace)
- View all recent calls with frequency, errors, params
- Trace problematic invocations back to source
This helps you understand caller-callee relations and debug when method is misbehaving only in some cases.
Use Cases
Method Tracing supports:
- Production incident debugging
- See why request chains failed
- Understand cross-service errors
- Performance analysis
- Find slow parts inside methods
- Understand which part of chain delays user
- Error analysis
- Filter by error to view root cause
- Cleanup and optimization
- Detect methods called too often or unnecessarily
- Cross-service visibility
- See full flow even with microservice boundaries
Summary
BitDive Method Tracing is the most detailed view into how your application runs:
- Trace real requests across services
- Drill into method calls, params, and performance
- See all errors and problematic cases
- Analyze REST, SQL, queue operations in context
- Understand exactly how each service interacts
With Method Tracing, developers, SREs, and performance engineers can solve the hardest production issues quickly and with full confidence. These deep traces also power the creation of automated unit tests from real behavior.