BitDive MCP (Model Context Protocol) - User Documentation
What is BitDive MCP?
BitDive MCP (Model Context Protocol) is an advanced debugging and observability interface designed for modern Java microservices applications. It provides runtime insights by combining call traceability, performance monitoring, and real-time heap data, enabling developers, SREs, and QA engineers to diagnose issues, optimize code, and validate application behavior without invasive tools or guesswork.
Available MCP Tools
Call Tracing Tools
| Tool Name | Description |
|---|---|
mcp_bitdive_getLastCallService | Retrieves a list of recent service call runs, including their trace IDs, for a specified module and service. Useful for tracking recent activity and debugging. |
mcp_bitdive_findTraceAll | Returns the full call trace for a specified call ID. This provides a detailed view of the execution path for a particular service call. |
mcp_bitdive_findTraceForMethod | Returns the call trace for a specific method within a given call ID, class, and method name. Useful for pinpointing issues in method-level execution. |
mcp_bitdive_findTraceForMethodBetweenTime | Returns the call trace for a specific class and method between given start and end timestamps. Useful for analyzing method behavior over a time range. |
Performance Monitoring Tools
| Tool Name | Description |
|---|---|
mcp_bitdive_getCurrentHeapMapAllSystem | Returns system performance metrics for all modules and services in the system. Provides a holistic view of system health and resource allocation. |
mcp_bitdive_getCurrentHeapMapForModule | Returns system performance metrics for a specific module. Useful for module-level resource monitoring. |
mcp_bitdive_getCurrentHeapMapForModuleAndForService | Returns system performance metrics (such as heap usage) for a specific module and service. Useful for monitoring resource usage and performance bottlenecks. |
mcp_bitdive_getCurrentHeapMapForModuleAndForServiceClass | Returns system performance metrics for a specific module, service, and class. Enables fine-grained monitoring and troubleshooting. |
Common Use Cases
BitDive MCP tools excel in several critical scenarios:
Root Cause Analysis - Analyze full call chains with findTraceAll to identify the source of issues.
Debugging Complex Problems - Drill into method behavior via findTraceForMethod to understand execution flow.
N+1 Query Detection - Compare SQL volumes across traces to identify inefficient database access patterns.
Performance Bottleneck Identification - Monitor system/module/class heap and timing metrics to locate slowdowns.
Regression Testing - Use trace replays to validate fixes by comparing before and after behavior. See Unit Testing from Traces.
CI/CD Observability - Integrate MCP for live trace checks before deployment to catch issues early.
Connect Your AI Tools to BitDive (MCP Integration)
Supercharge your development workflow by connecting AI tools like Cursor and Claude directly to BitDive. This integration allows your AI assistant to access and understand your application's performance data, giving you powerful insights right in your editor.
Setup is just two simple copy-paste steps.
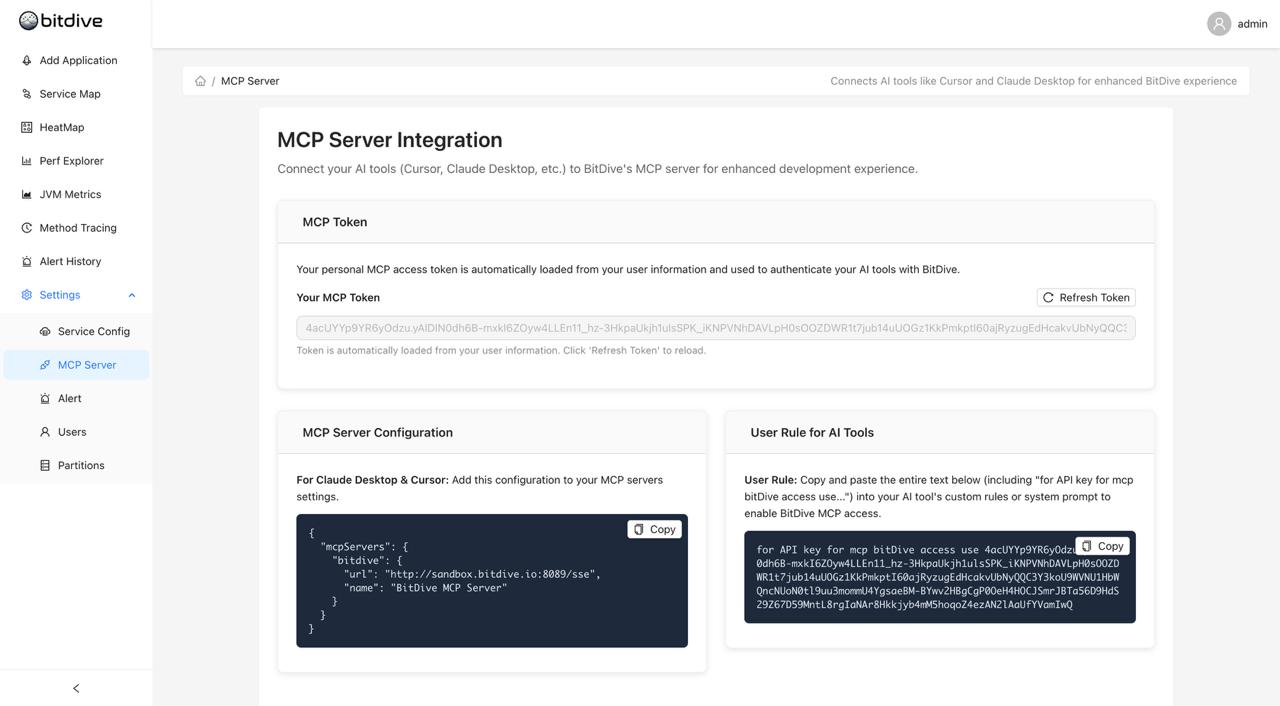
Step 1: Configure Your AI Tool
First, you need to tell your AI tool how to connect to the BitDive MCP Server.
- Go to the MCP Server Configuration card
- Click the Copy button to grab the server settings
- Paste this configuration into your AI tool's server settings (e.g., in Cursor or Claude Desktop)
Step 2: Set the User Rule
Next, you need to give your AI tool a special instruction so it knows how to access BitDive securely.
- Go to the User Rule for AI Tools card
- Click the Copy button to get the entire block of text
- Paste this into your AI tool's "custom rules" or "system prompt" section
What is this? This rule tells your AI assistant, "When you need to access BitDive, use this special API key." It's a secure way to grant access without you having to do anything manually.
All Done!
That's it! Your AI tool is now connected to BitDive. You can start asking it questions about your application's performance, and it will use live data from BitDive to give you accurate, runtime context-aware answers.
Closing the Loop: How AI Agents Self-Verify with BitDive
In 2026, we don't just use AI to write code; we use it to verify and fix production behavior with high confidence. BitDive MCP enables a 3-step deterministic protocol for AI agents:
- Step 1: Context Injection (MCP): The AI reads the failed production trace or performance bottleneck from BitDive. It sees the exact SQL parameters, method inputs, and exceptions.
- Step 2: Informed Fix: Informed by real runtime context, the AI proposes a code fix. It isn't guessing; it's reacting to reality.
- Step 3: Deterministic Self-Verification: The AI verifies the fix using two complementary mechanisms:
- Replay tests (
mvn test): Run the existing JUnit tests built from captured traces to confirm that internal behavior stayed consistent. Replay tests verify logic against recorded baselines but do not produce new traces. - Before/after trace comparison: Trigger the same API call on the updated service (via curl, Postman, or an automated script) so BitDive's agent captures a new trace. Then compare the new trace against the original to verify that the actual runtime behavior (SQL queries, HTTP exchanges, call sequences) changed only as intended.
- Replay tests (
This process establishes what we call AI Code Verification, a deterministic boundary for AI-generated code.
AI Engineering Case Study BitDive MCP Server: Bringing JVM Runtime Context to AI Agents
Example Prompt for Cursor:
"I see a 500 error in BitDive trace
trace-123. Use MCP to analyze the root cause, fix the logic inOrderService, and then help me run a BitDive Replay to verify the fix works."
Example Workflow: Diagnosing an N+1 Query Problem
A typical workflow for diagnosing and fixing an N+1 query problem involves:
- Using
findTraceAllto explore the full call context of a slow endpoint - Identifying excessive SQL volume by examining the trace details
- Implementing a fix in code (for example, using
@EntityGraphin JPA) - Replaying with the same conditions to confirm query reduction
- Comparing before/after traces to quantify performance improvements
Case Study: Performance Optimization
In a real-world application, BitDive MCP helped identify and fix an N+1 query problem with impressive results:
Before optimization: 243 SQL queries in a single endpoint call (typical N+1 pattern) After optimization: 1 optimized query using EntityGraph Improvement: 99.6% reduction in queries, 86% faster response time
The complete traces were compared using:
deb61f9e-3f2f-11f0-bda4-4f2e85a73b5e(before optimization)d2e4f42a-3f30-11f0-98c8-b9eeeeb12adb(after optimization)
Integration with Development Workflow
BitDive MCP integrates seamlessly into development workflows:
Code Review Process - Use BitDive MCP during reviews to analyze performance impacts of changes and provide data-driven feedback on optimization opportunities.
CI/CD Pipeline - Monitor deployment performance in real-time, detect performance regressions automatically, and validate optimization improvements with concrete metrics.
Bug Investigation - Trace issue reproduction with complete call flows, analyze historical data to identify patterns, and provide actionable insights for fixes.
Security Considerations
BitDive MCP is designed with security in mind. It uses secure communication protocols with server-side authentication. The MCP server handles all authentication, and there is no direct database access from AI. All tool usage is logged for audit purposes.
Performance Best Practices
When using BitDive MCP, consider these performance optimization strategies:
- Start with broad system analysis before narrowing to specific components
- Use time-based analysis for behavioral patterns during specific windows
- Combine monitoring and tracing tools for complete understanding
- Schedule periodic system-wide performance analysis for baseline comparisons
- Use selective monitoring with granular tools to focus on specific areas
- Consider batching operations by combining related queries when possible
BitDive MCP transforms application monitoring from a reactive, manual process into a proactive, data-driven experience. By providing comprehensive runtime insights with minimal configuration, it enables developers to identify, diagnose, and fix issues with unprecedented precision and efficiency.