Comprehensive JVM Metrics Monitoring
Overview
JVM Metrics in BitDive give engineering teams deep insight into how Java applications utilize memory and system resources in production environments.
While distributed tracing and profiling focus on request execution and method latency, JVM Metrics address the platform itself - helping detect problems like memory leaks, high allocation rates, or garbage collection (GC) pauses before they impact application performance.
By using this view, developers and SREs can monitor memory usage trends, garbage collection activity, and JVM-level statistics without needing to connect external APM or monitoring tools.
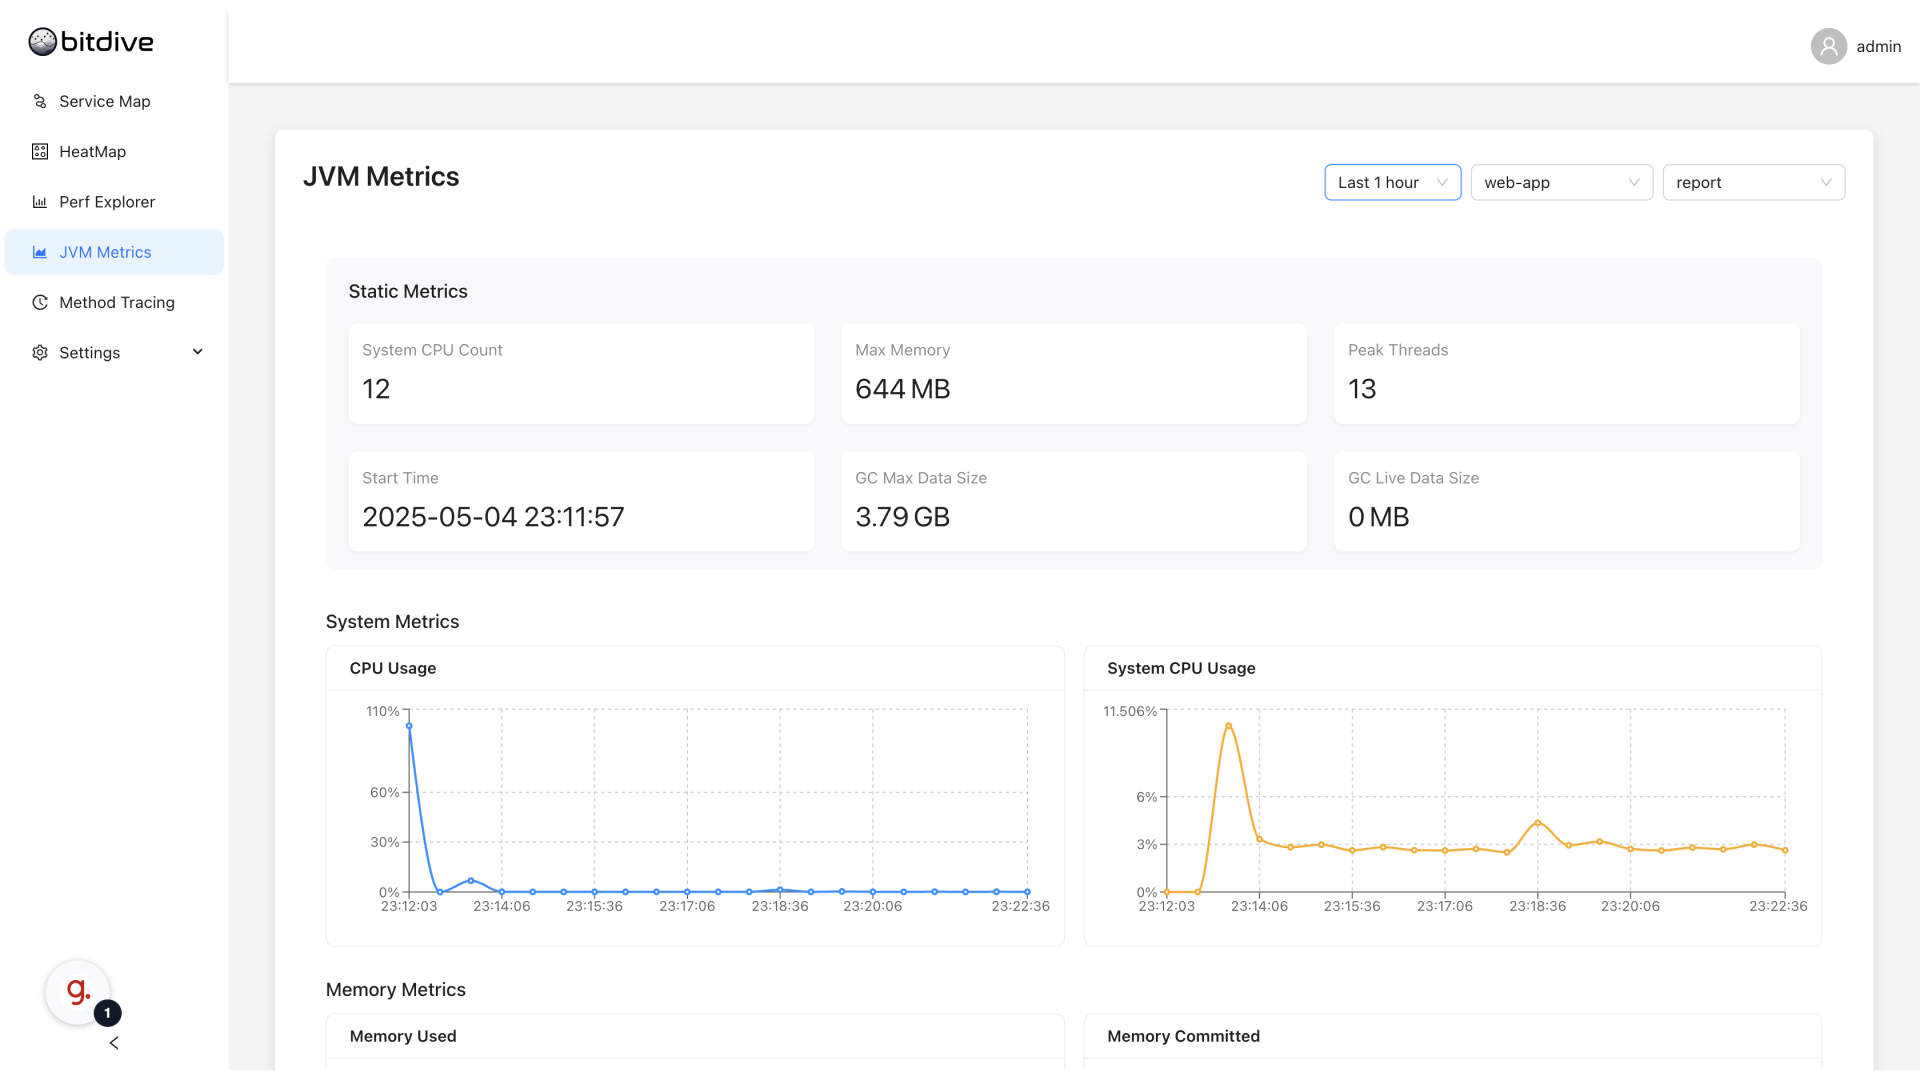
The dashboard displays critical system metrics in real-time:
- CPU Usage
- Memory Utilization
- Thread Management
- Disk Space
- Swap Memory
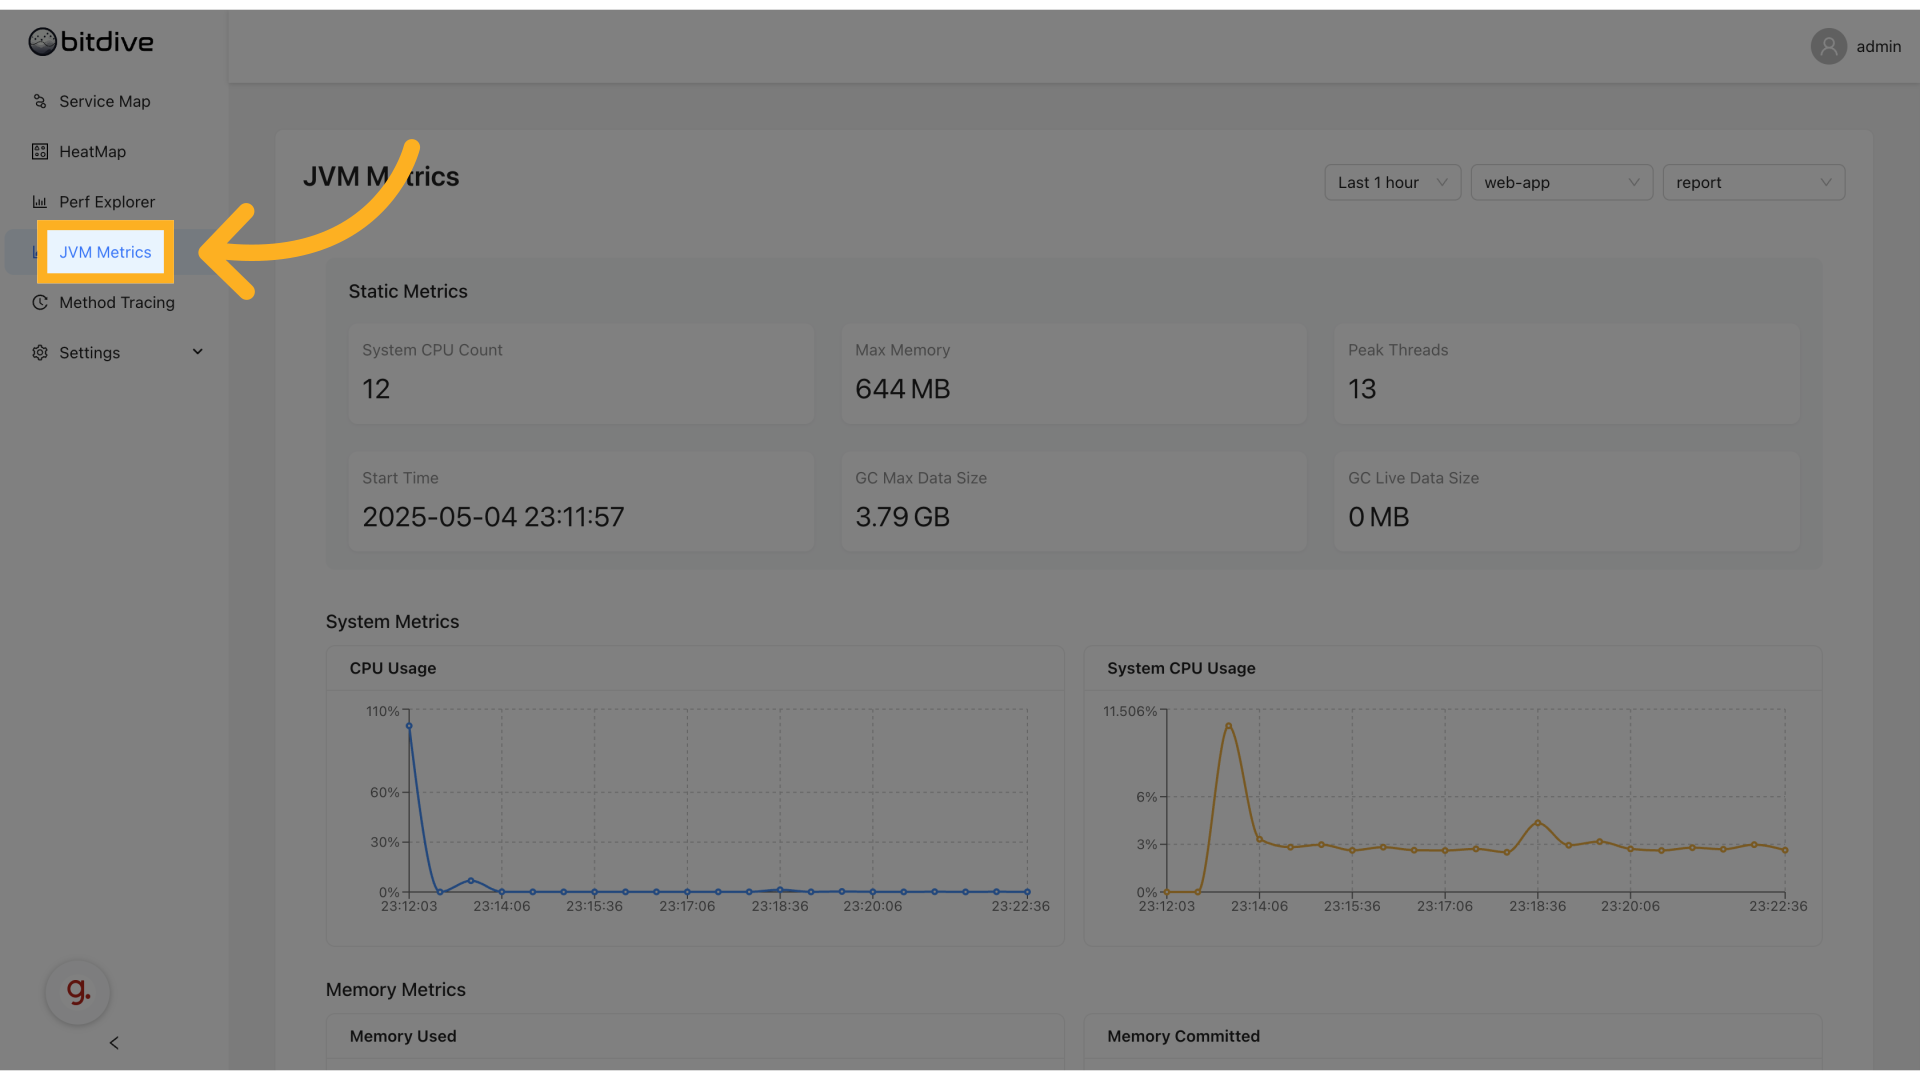
Accessing JVM Metrics
- Log in to the BitDive console
- Select JVM Metrics from the left navigation
You will see charts showing live JVM performance data across all application modules and microservices.
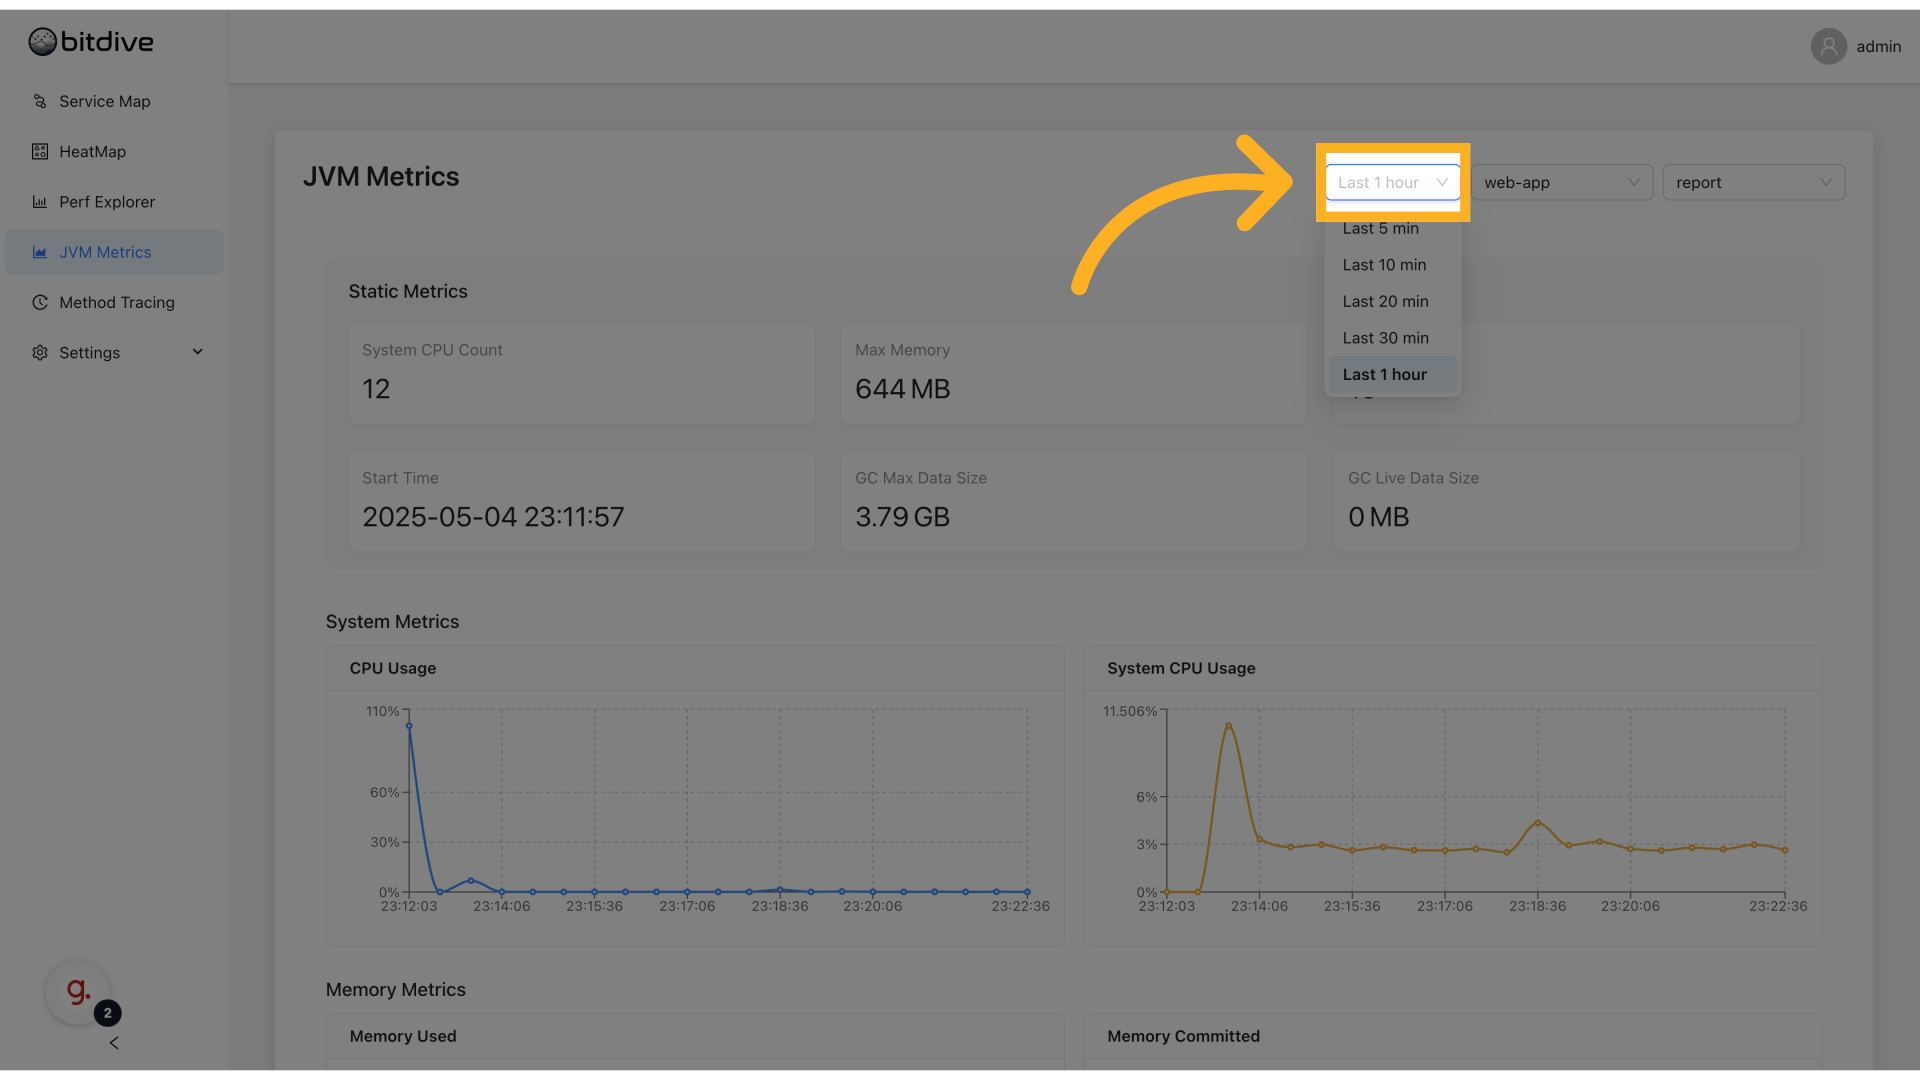
Filtering and Time Control
Like other BitDive views, JVM Metrics supports:
- Time Range Selection - Choose Last 5 minutes, Last 1 hour, or custom ranges
- Auto Refresh Toggle - Enable to keep data updating in real time
This allows for both historical analysis and live debugging.
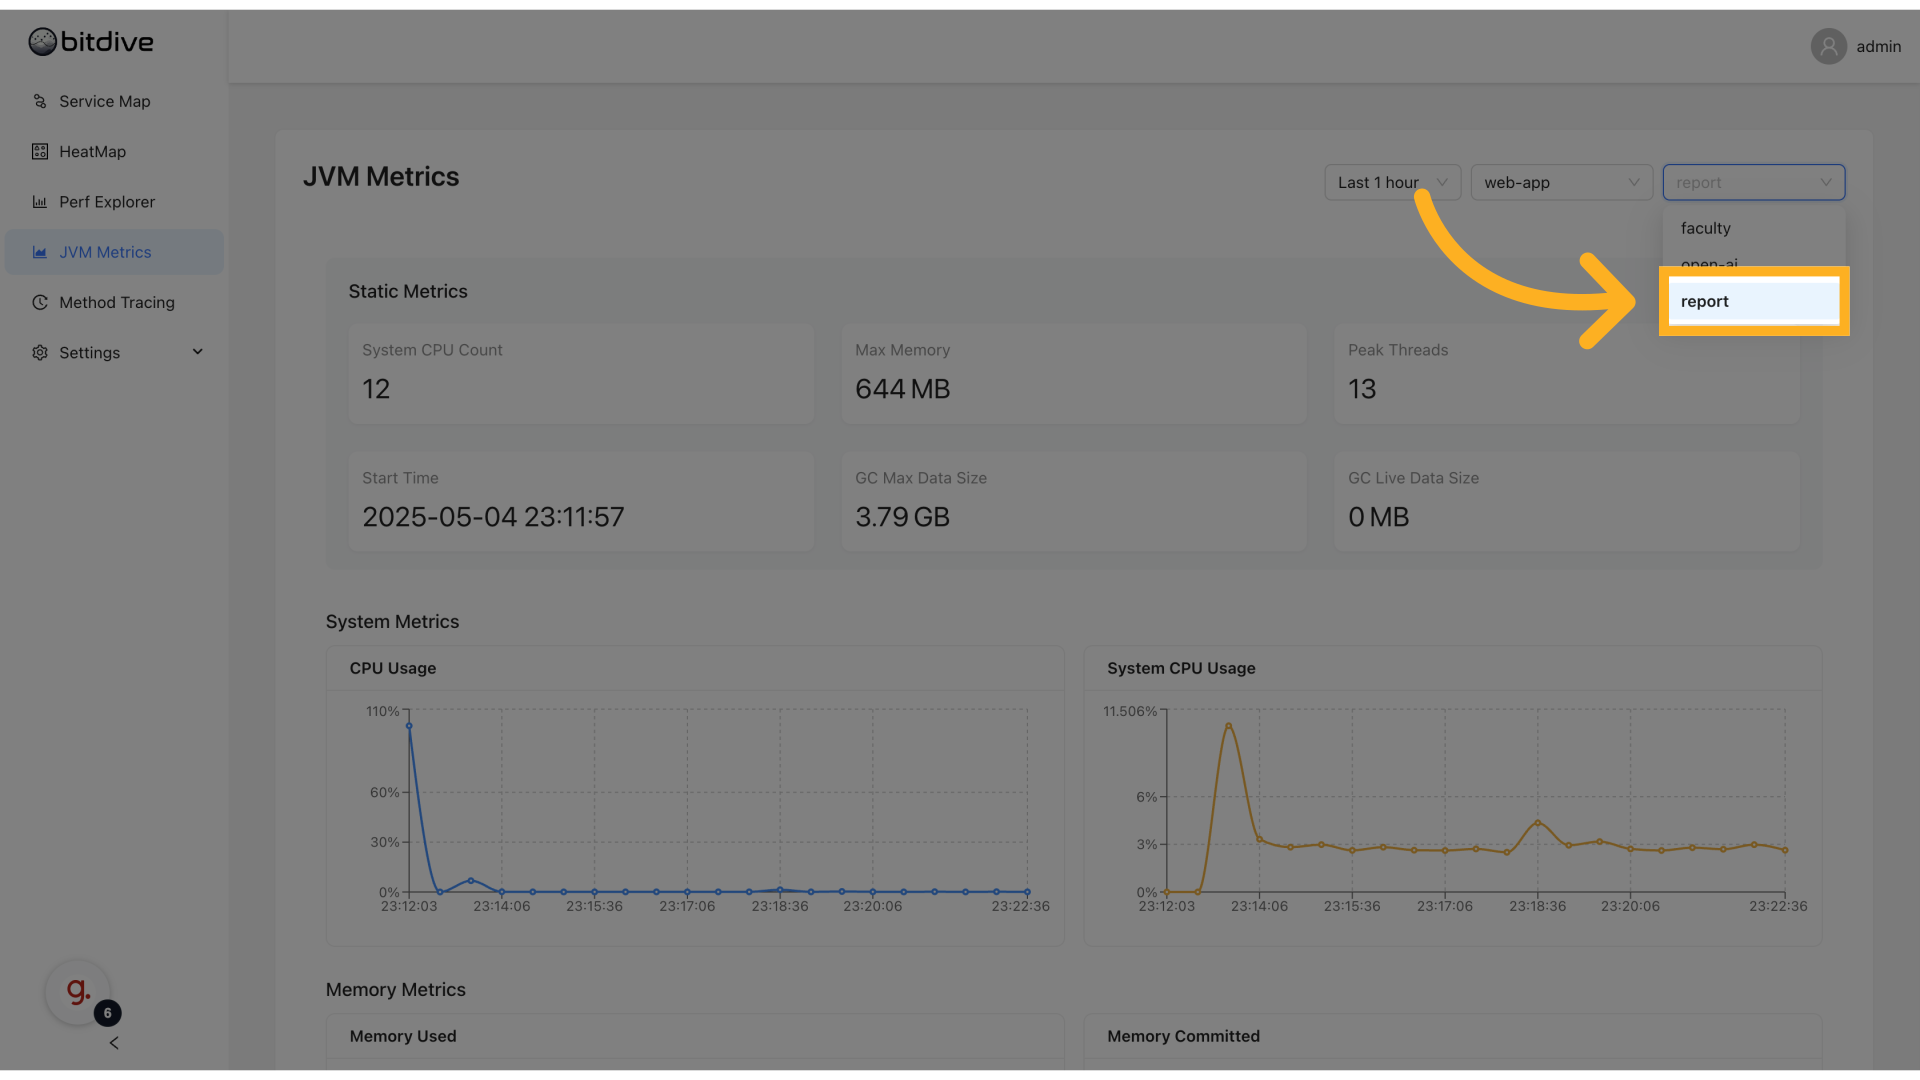
Application and Service Filtering
To narrow your view:
- Select the application module (e.g.
web-app) to focus on - Select a specific microservice (e.g.
report) to drill down further
This makes it easy to isolate memory issues in a specific part of your system.
Key Performance Indicators (KPIs)
The header displays four primary metrics:
| Metric | Description |
|---|---|
| CPU Usage | Current system CPU load (%) |
| Memory Used | Active heap memory usage (MB) |
| Thread Count | Number of active threads |
| Processors | Available CPU cores |
JVM Metric Groups
BitDive organizes JVM metrics into groups that reflect key JVM areas:
Memory Metrics
- Heap Used - How much heap memory is actively used
- Heap Committed - JVM guaranteed heap allocation
- Non-Heap Used - Memory outside the heap (e.g., Metaspace, Code Cache)
- Memory Allocated - Total allocated memory during runtime
Garbage Collection Metrics
- GC Pause Time - Time spent by JVM threads in GC
- GC Memory Allocated - Amount of memory GC cleaned up
- GC Frequency - How often garbage collections occur
Allocation Rate
- Allocation Rate (bytes/sec) - How much memory is being allocated by the app
Each metric is visualized using time-series graphs to help:
- Spot sudden increases in allocation (potential leaks)
- Detect long GC pauses (leading to app freezes)
- Analyze if allocation pressure correlates with throughput dips
Summary
JVM Metrics in BitDive close the gap between application performance profiling and system-level JVM monitoring.
By combining them with HeatMap, Performance Explorer, and Service Map, teams can gain complete observability:
- Visualize method-level and service-level performance
- Analyze JVM memory usage and GC activity
- Detect and fix issues at every level - from business logic to runtime internals
JVM Metrics help Java teams operate production systems with confidence - and without surprises.
Engineering Insight Measuring Software Performance: Beyond Baselines in a Microservices World