Service Configuration Guide
The Service Configuration screen is your command center for customizing how BitDive monitors each of your applications and services. Here, you can adjust settings on the fly, create different monitoring profiles for various environments (like "test" or "production"), and control exactly what data is collected.
1. Finding Your Service
On the left, you'll see a list of all your Projects & Services. Simply click on a project to see its services, then select the service you want to configure.
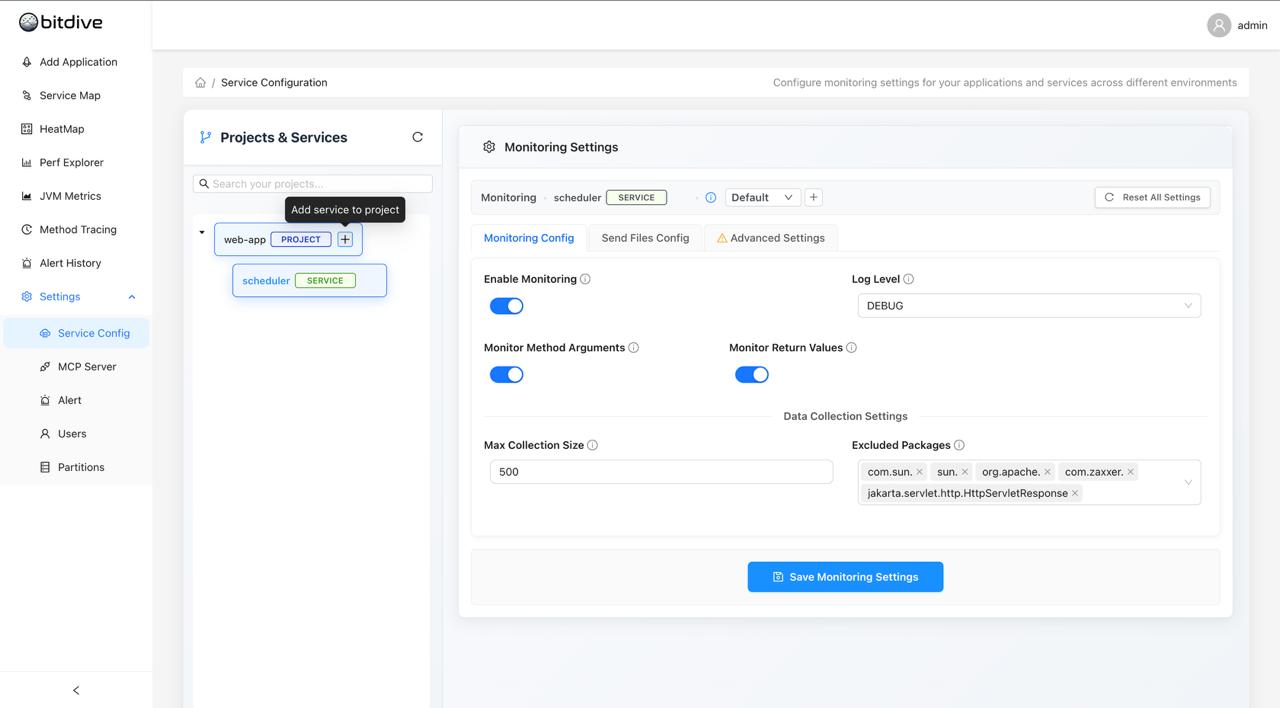
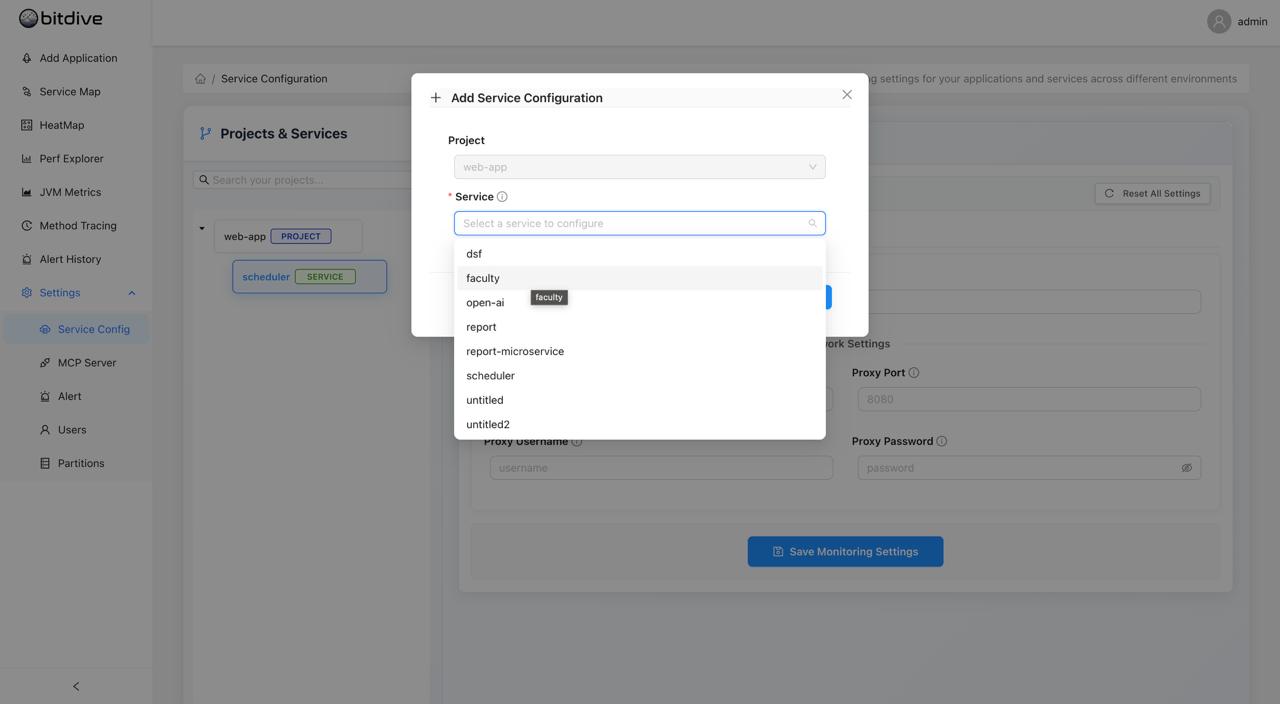
To add a new service to a project, hover over the project name and click the '+' icon.
2. Adjusting Monitoring Settings
Once you've selected a service, you can change its monitoring behavior in the main panel.
Here's the main configuration interface where you can adjust all monitoring settings:
Monitoring Config Tab
This is where you'll find the most common settings:
- Enable Monitoring: The main on/off switch for BitDive's monitoring on this service
- Log Level: Adjust how much detail you get in your logs (e.g., DEBUG, INFO)
- Monitor Method Arguments/Return Values: Toggle these to capture the data going into and out of your methods
- Excluded Packages: Add any packages (like third-party libraries) that you don't want BitDive to monitor
Click Save Monitoring Settings when you're done.
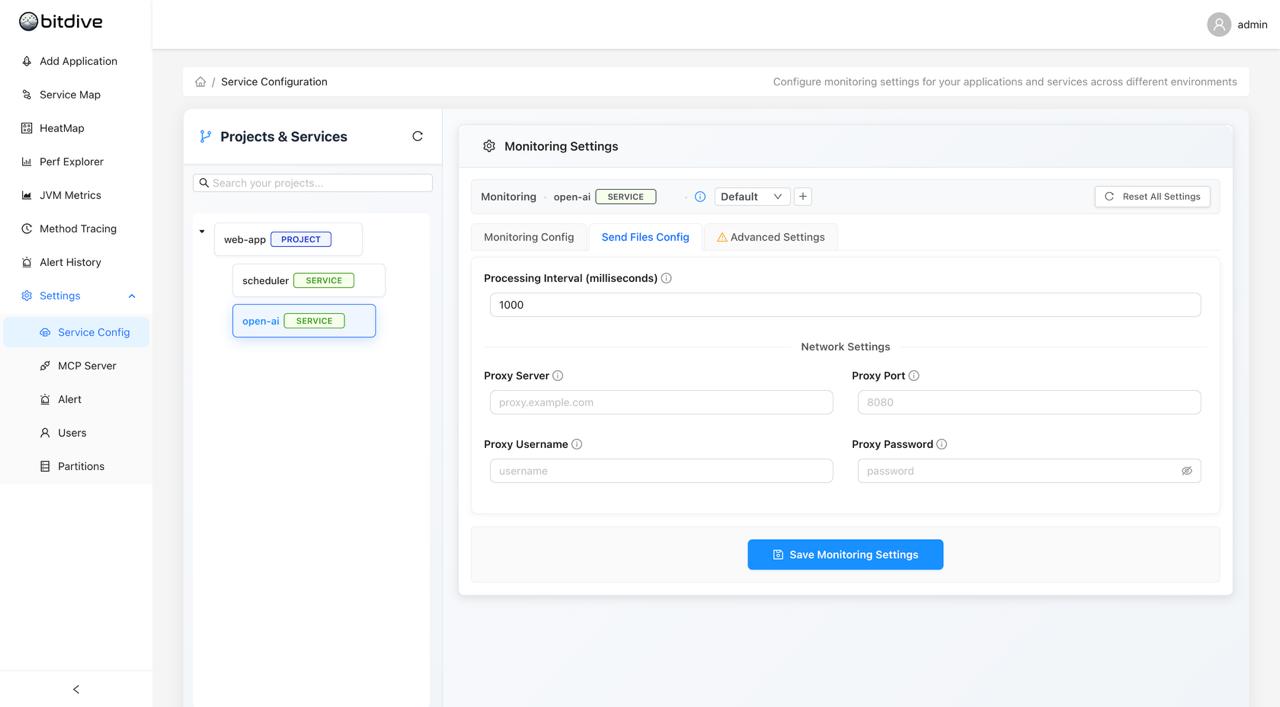
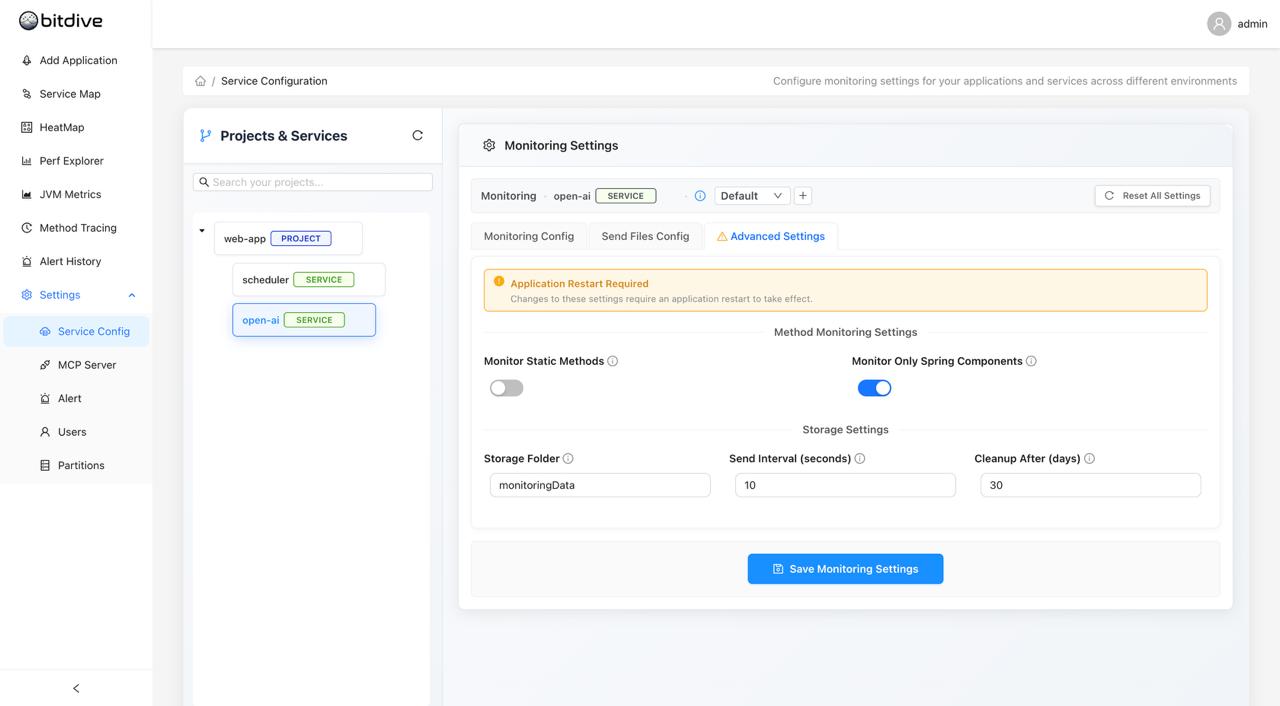
Send Files Config & Advanced Settings
- Send Files Config: Configure settings related to network and data transmission, like proxy servers
- Advanced Settings: Access deeper configurations for storage, data cleanup, and specific framework monitoring (like only monitoring Spring components). This is also where you configure PII Data Masking.
Serialization and PII Data Masking
To ensure compliance with privacy standards (like GDPR), BitDive provides a Sensitive Keywords configuration under the Advanced Settings tab.
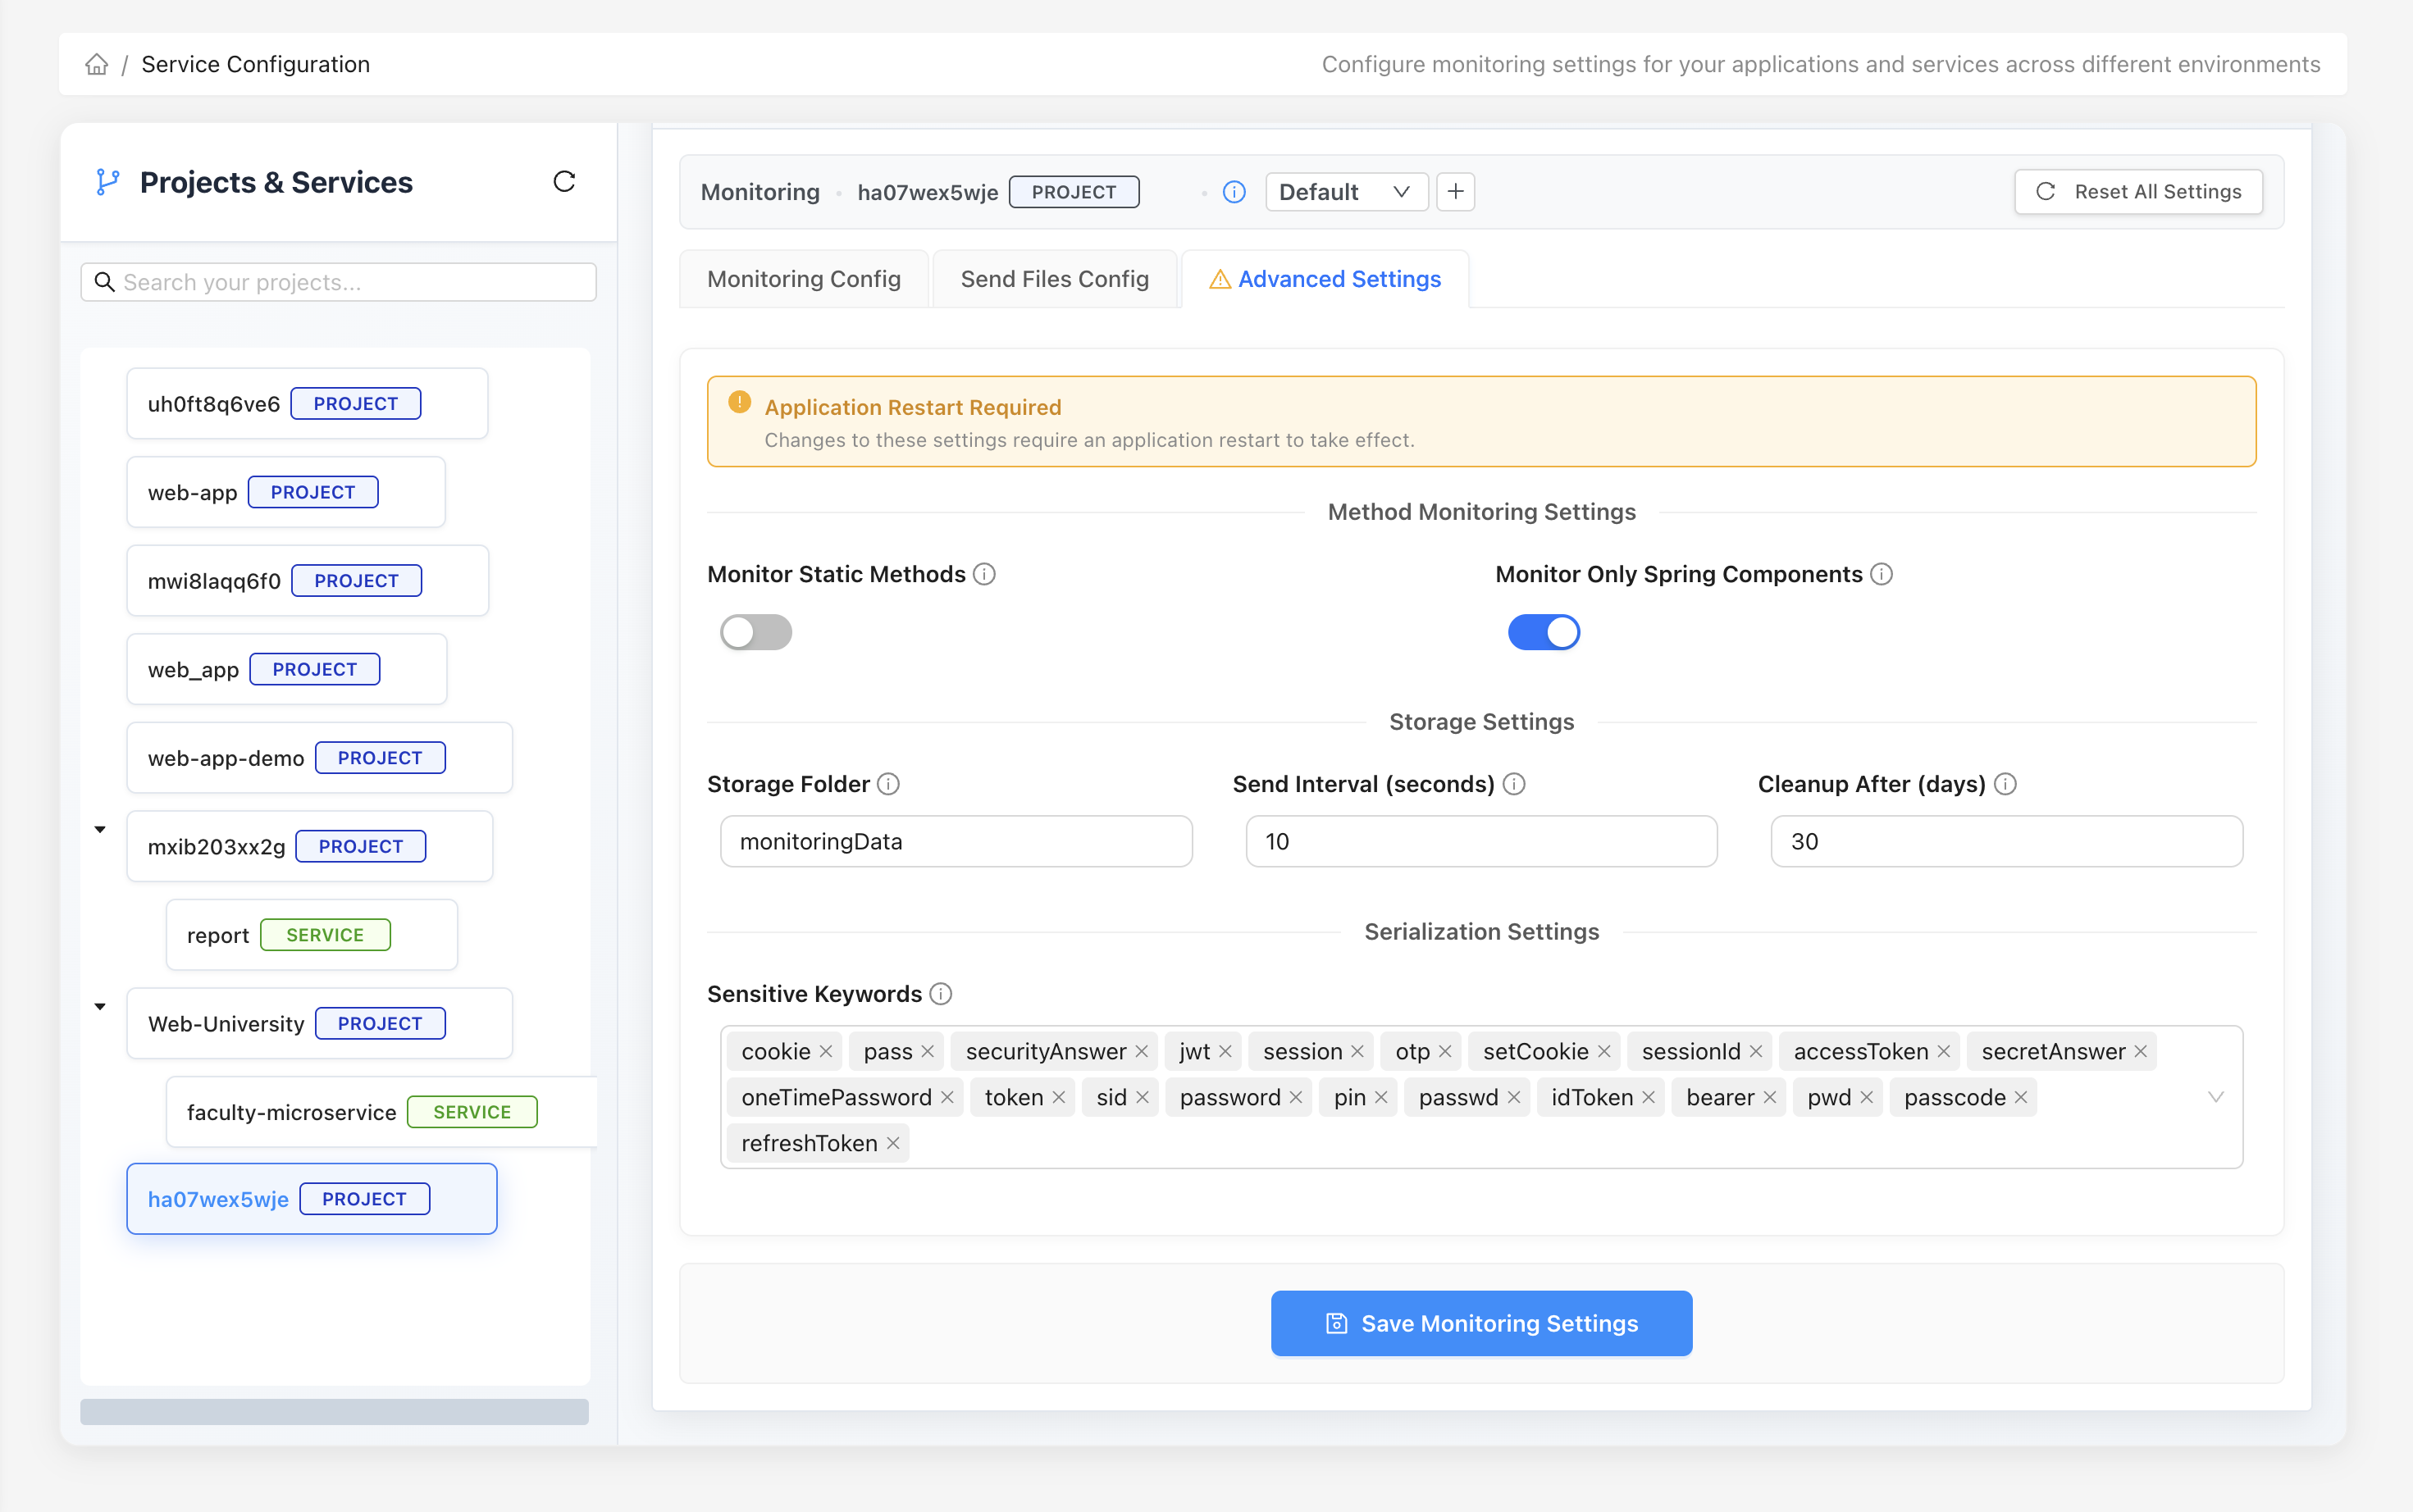
When BitDive captures data, it automatically masks the values of any fields that match these keywords (e.g., password, token, cookie, secret). This ensures that sensitive information is never recorded in plain text.
Important: A yellow banner will appear if a setting requires an application restart to take effect.
3. Using Different Profiles (Environments)
You can create multiple monitoring profiles for a single service. This is ideal for having different settings for your "Default" (development), "Test," and "Production" environments.
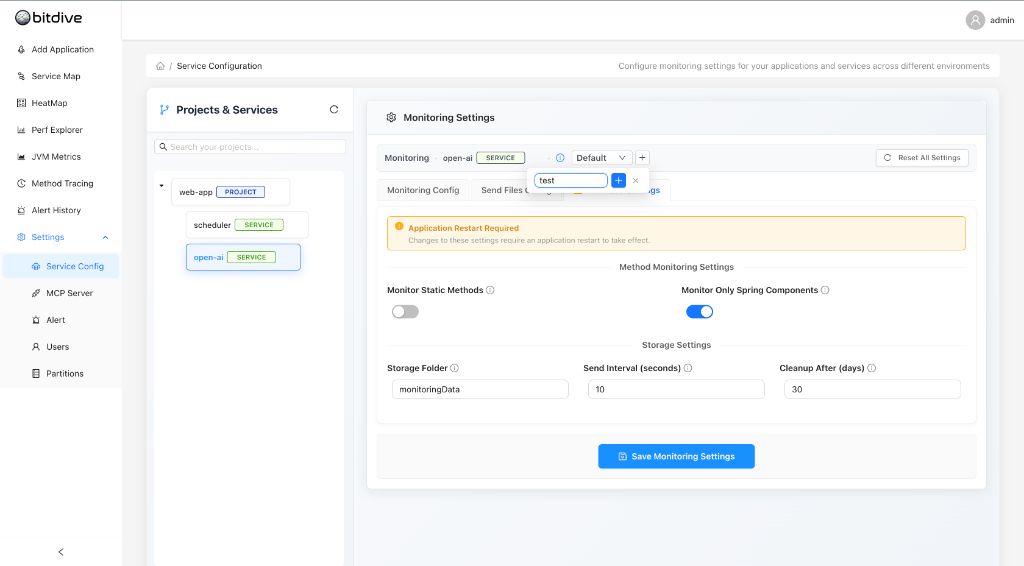
- Click the '+' button next to the "Default" profile dropdown
- Give your new profile a name (e.g., "test")
- Now you can select this new profile from the dropdown and give it its own unique monitoring settings!
If you need to reset settings back to defaults, you can use the reset function:
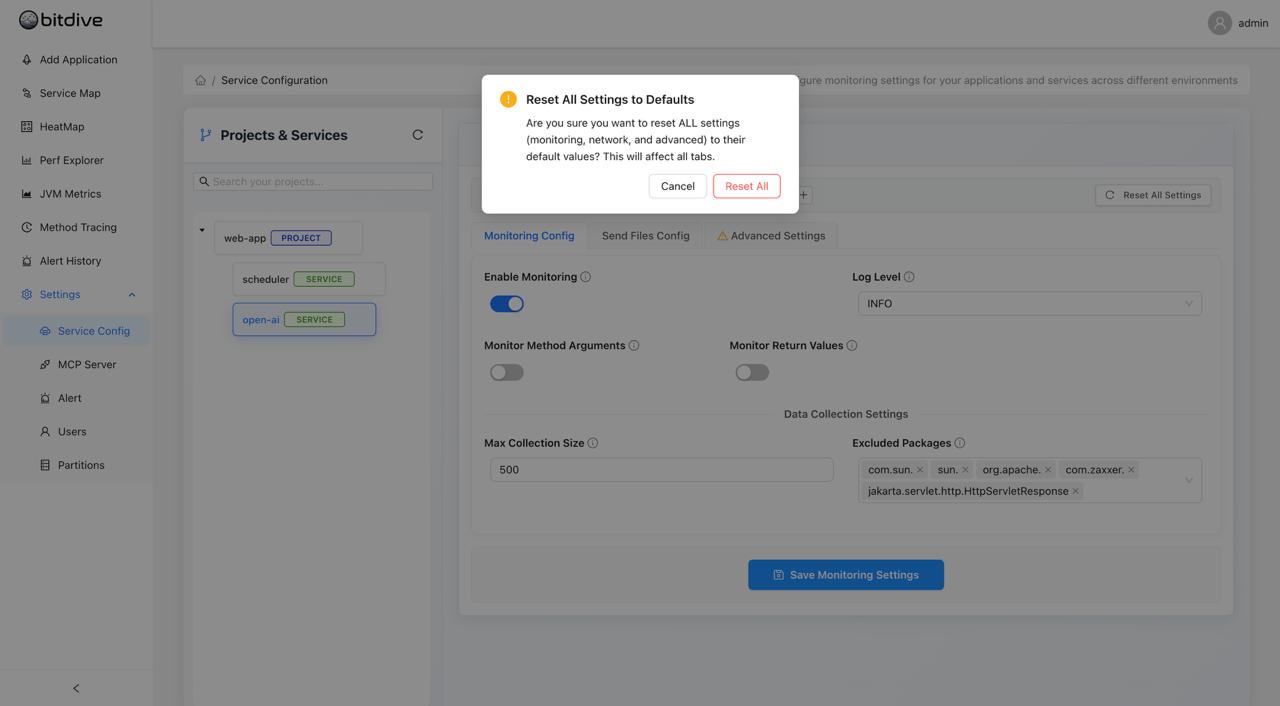
This allows you to, for example, turn on detailed DEBUG logging for your "test" environment while keeping your "production" environment cleaner with INFO-level logging.
Configuration Parameters Reference
Understanding what each setting does helps you fine-tune BitDive's monitoring behavior:
Monitoring Configuration Settings
Essential Settings
| Setting | Description | When to Use |
|---|---|---|
| Enable Monitoring | Master switch for BitDive monitoring | Turn off when troubleshooting or reducing overhead |
| Log Level | Amount of detail in monitoring logs | DEBUG: Development/testing, INFO: Production, ERRORS: Minimal logging |
| Monitor Method Arguments | Captures input parameters to methods | Enable for debugging data flow issues |
| Monitor Return Values | Captures what methods return | Enable when tracking output problems |
| Monitor Static Methods | Includes static method calls in traces | Usually disable for cleaner traces |
| Spring Components Only | Limits monitoring to Spring-managed beans | Enable to focus on business logic, not framework code |
Application Identity
| Setting | Description | Best Practice |
|---|---|---|
| Module Name | Identifies your application module | Use descriptive names like "user-service" or "payment-api" |
| Service Name | Identifies specific service within module | Use specific names like "authentication" or "order-processing" |
| Package Scanner | Which Java packages to monitor | Include your main business packages, exclude third-party libraries |
Network & Storage Settings
| Setting | Description | Why It Matters |
|---|---|---|
| Server URL | Where to send monitoring data | Must match your BitDive server address |
| Send Interval | How often to upload data (seconds) | Lower = more real-time, Higher = less network traffic |
| File Storage Time | How long to keep local monitoring files | Longer = more disk space used, Shorter = risk of data loss |
| Proxy Configuration | Network proxy settings | Required if your network uses proxies |
Performance Tuning
| Setting | Description | Impact |
|---|---|---|
| Excluded Packages | Skip monitoring certain packages | Add com.sun., org.springframework. to reduce noise |
| Max Collection Elements | Limit array/list capture size | Higher = more detail, Lower = better performance |
| File Conversion Interval | How often to process monitoring data | Lower = more responsive, Higher = less CPU usage |
| Sensitive Keywords | Keywords used to mask PII data | Add password, token, jwt to ensure data privacy |
Environment Profiles
| Profile Type | Recommended Settings | Use Case |
|---|---|---|
| Development | DEBUG logging, Monitor arguments/returns | Full visibility for debugging |
| Test | INFO logging, Monitor returns only | Balanced monitoring for testing |
| Production | INFO/ERRORS logging, Minimal monitoring | Performance-focused monitoring |
Understanding Log Levels
| Level | What You See | When to Use |
|---|---|---|
| ERRORS | Only error messages and failures | Production systems where you only want alerts |
| INFO | General operations and normal flow | Standard production monitoring |
| DEBUG | Detailed execution information | Development, testing, or troubleshooting issues |
💡 Tip: Start with INFO in production, switch to DEBUG only when investigating specific problems.
Engineering Insight Smart Noise Reduction: Ensuring Deterministic Testing Across Environments
For getting started quickly, refer to our Quick Start Guide.