Method Tracing
The Method Tracing feature provides detailed insights into method execution, allowing you to trace and analyze calls across your distributed system. It offers multiple views to understand the flow and performance of method calls.
Overview
Method Tracing offers three main visualization modes:
- Call Timeline
- Call Tree
- Call Graph
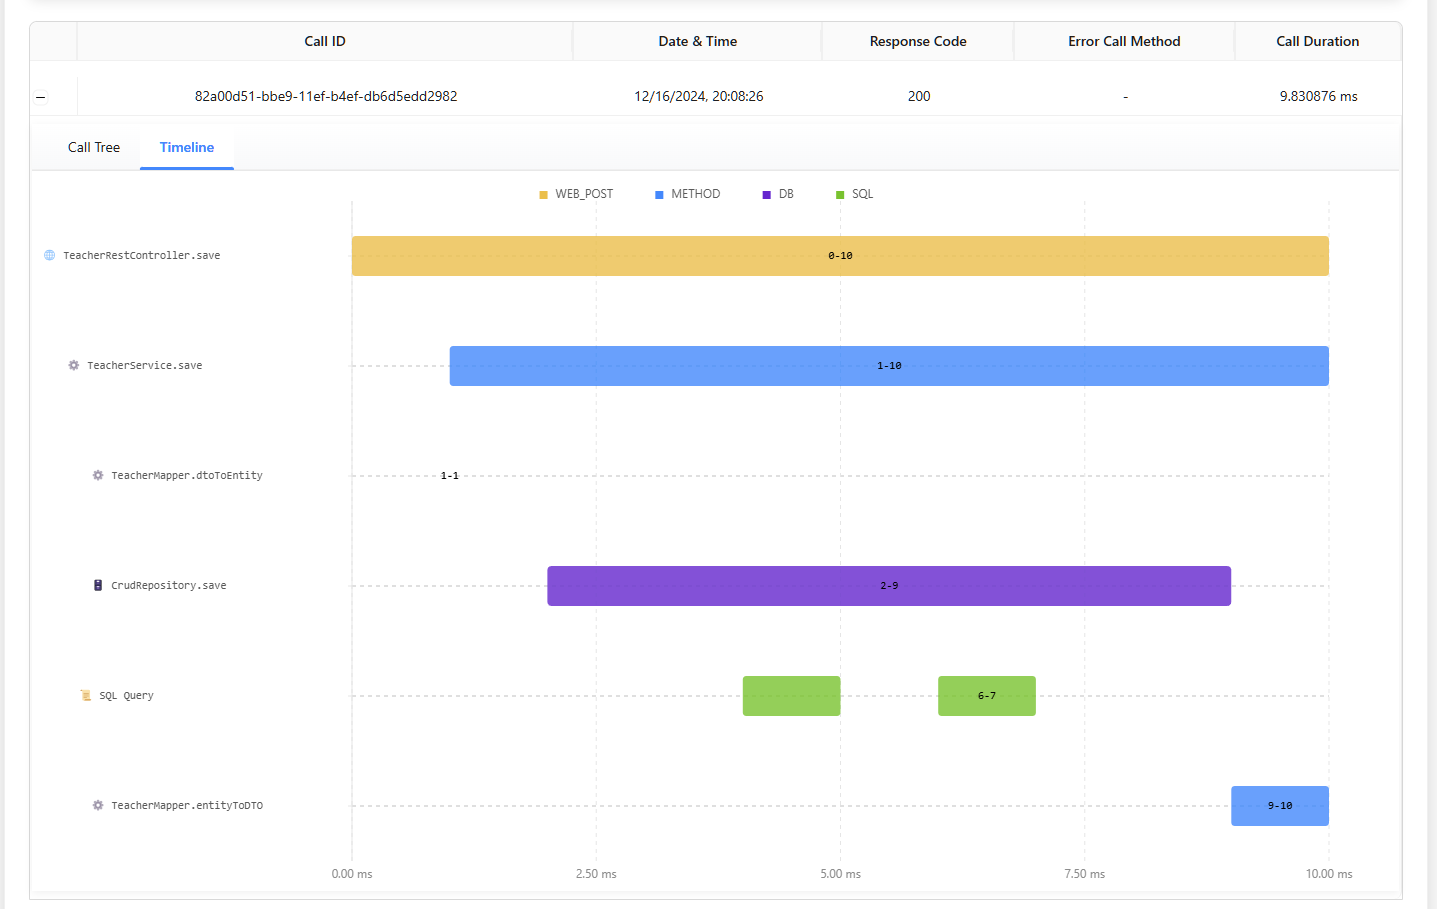
Call Timeline View
The timeline view displays the sequential execution of methods, showing:
- Execution duration
- Parallel operations
- Method dependencies
- Operation types (WEB_POST, METHOD, DB, SQL)
Call Tree View
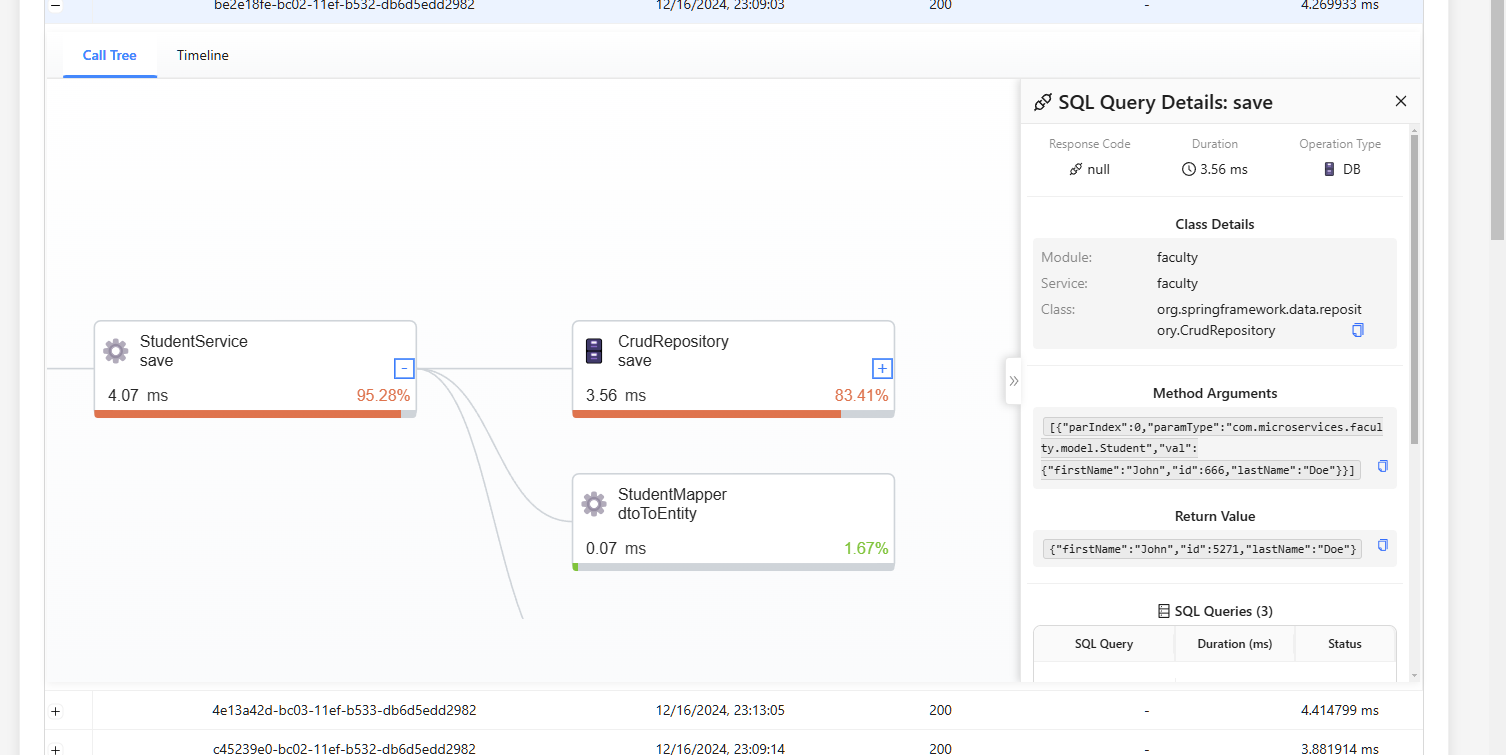
The tree view provides a hierarchical representation of method calls:
- Parent-child relationships
- Execution order
- Method parameters and return values
Call Graph View
The graph view visualizes service interactions:
- Service dependencies
- Call flow direction
- Communication patterns
Key Features
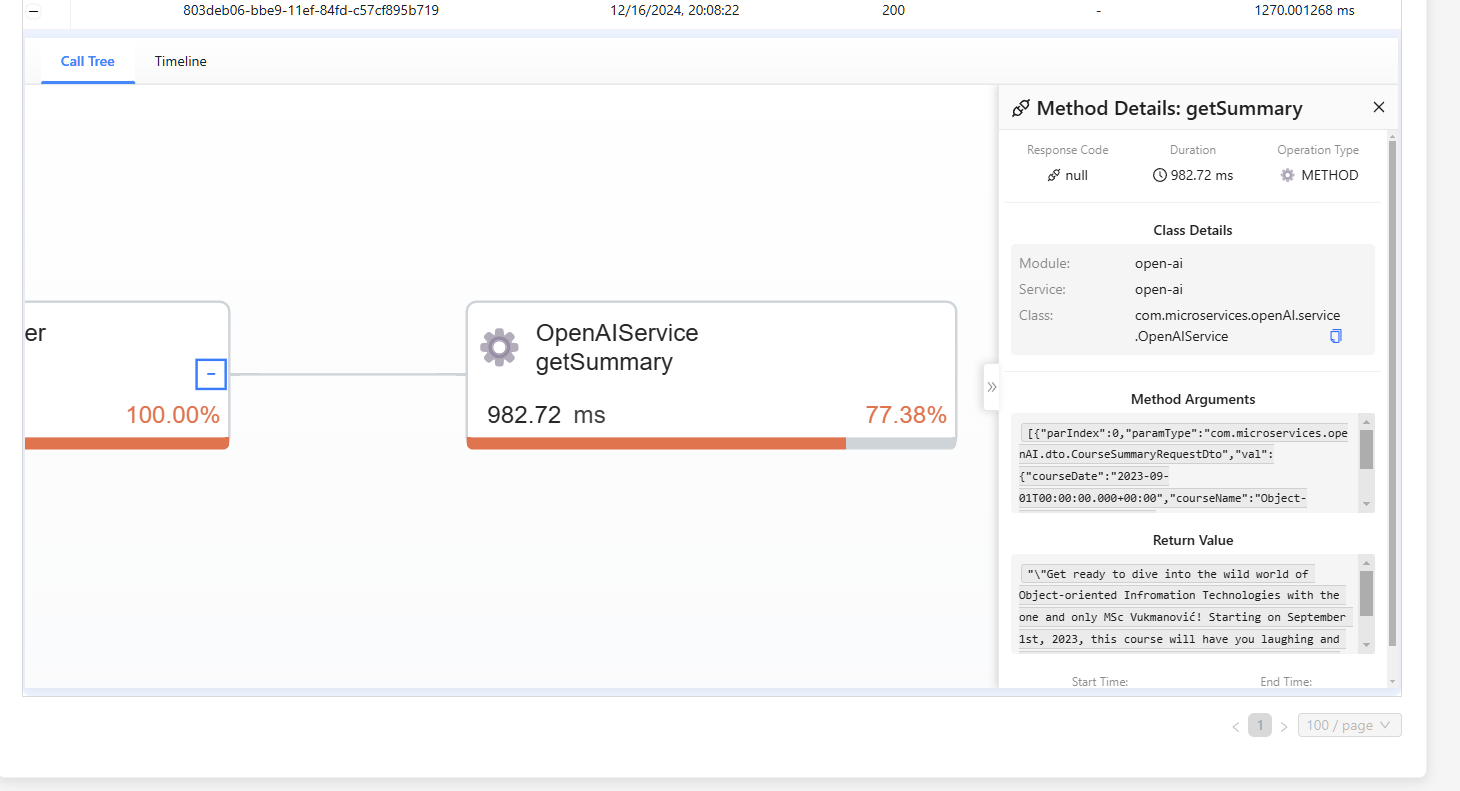
1. Method Call Details
Each call record shows:
- Call ID
- Date & Time
- Response Code
- Error Call Method (if applicable)
- Call Duration
2. Operation Types
Color-coded operation types:
- WEB_POST: External API calls
- METHOD: Internal method calls
- DB: Database operations
- SQL: SQL queries
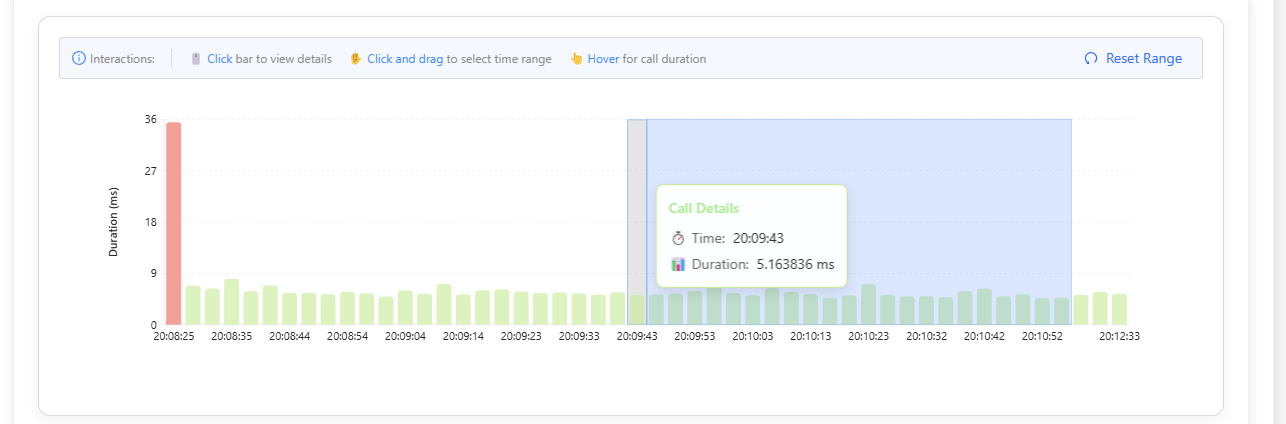
3. Performance Metrics
For each call:
- Total duration
- Individual step timing
- SQL query execution time
- Error information
Using Method Tracing
1. Navigation
- Select a method from the dropdown
- Choose visualization type:
- Timeline for sequence analysis
- Tree for hierarchy view
- Graph for service interactions
2. Analysis Features
- Zoom in/out on timeline
- Expand/collapse tree nodes
- Filter by operation type
- Search for specific calls
3. Troubleshooting
Use Method Tracing to:
- Trace error paths
- Identify slow operations
- Analyze service dependencies
- Monitor database queries
Best Practices
1. Performance Analysis
- Review call durations
- Check for parallel execution
- Monitor SQL query timing
- Look for bottlenecks
2. Error Investigation
- Examine error call methods
- Check response codes
- Review error context
- Trace error propagation
3. Optimization
- Identify slow methods
- Review database operations
- Check service dependencies
- Monitor call patterns
Tips and Tricks
-
Efficient Navigation
- Use search to find methods
- Filter by operation type
- Focus on specific time ranges
-
Performance Monitoring
- Track average response times
- Monitor error rates
- Check SQL query performance
-
Team Collaboration
- Share specific call traces
- Document common issues
- Track performance improvements