6 posts tagged with "Application Monitoring"

View All Tags

BitDive 1.2.6: WebSocket Support, Daily Statistics, and On-Air Configuration

· 3 min read
Artem Vavilov
Strategic Product Leader | Driving Innovation in Software Solutions

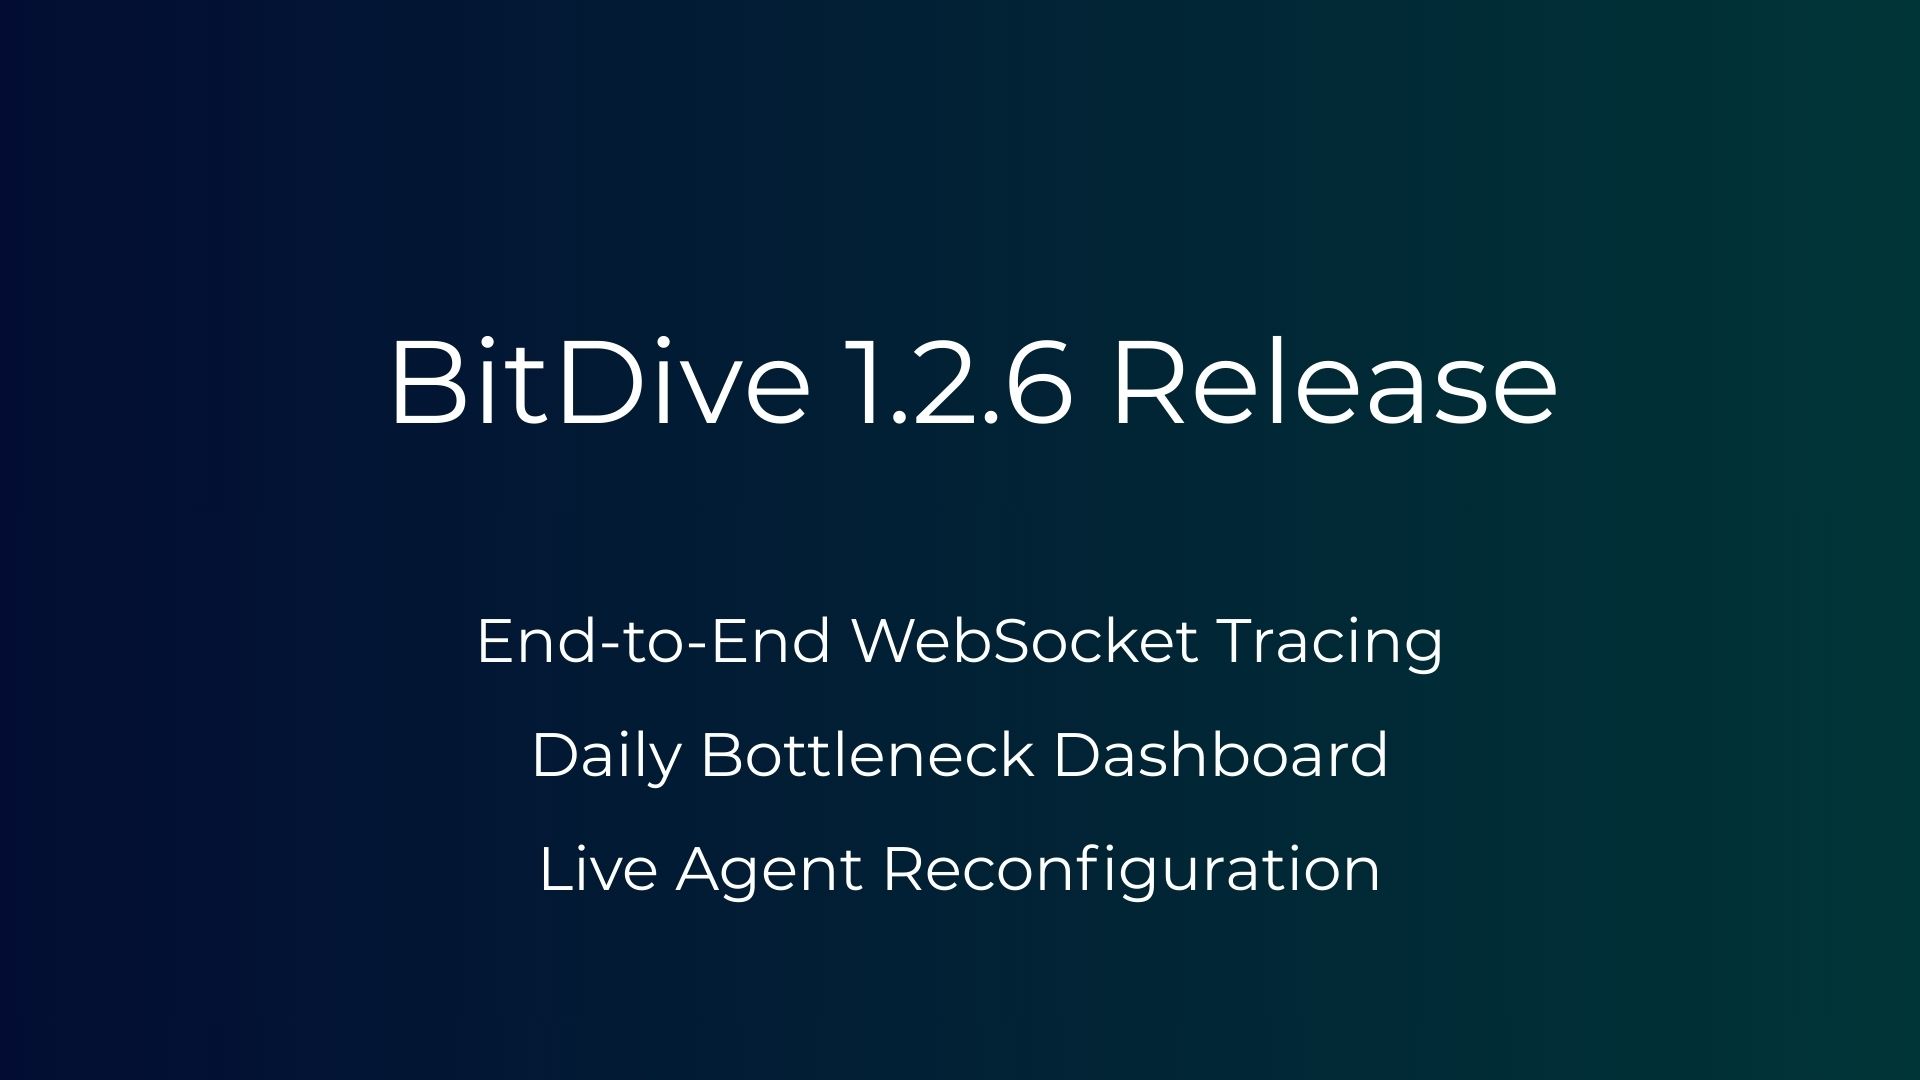
BitDive 1.2.6 Release

We're excited to announce the release of BitDive 1.2.6, bringing new capabilities that make runtime intelligence for JVM applications even more powerful and developer-friendly. This update expands protocol coverage, adds a new analytics view, and introduces flexible agent configuration - all designed to help teams move faster from problem detection to resolution.

BitDive Full Lifecycle Testing for JVM Applications

· 4 min read
Artem Vavilov
Strategic Product Leader | Driving Innovation in Software Solutions

BitDive Full Lifecycle Testing for JVM Applications

Testing for JVM applications-Java, Kotlin, Spring Boot-often struggles to keep up with distributed systems, asynchronous flows, and frequent code changes. Traditional methods rely on mocks and black‑box checks that don't reflect how the system really behaves. The result: flaky tests, missed bugs, and uncertainty before release.

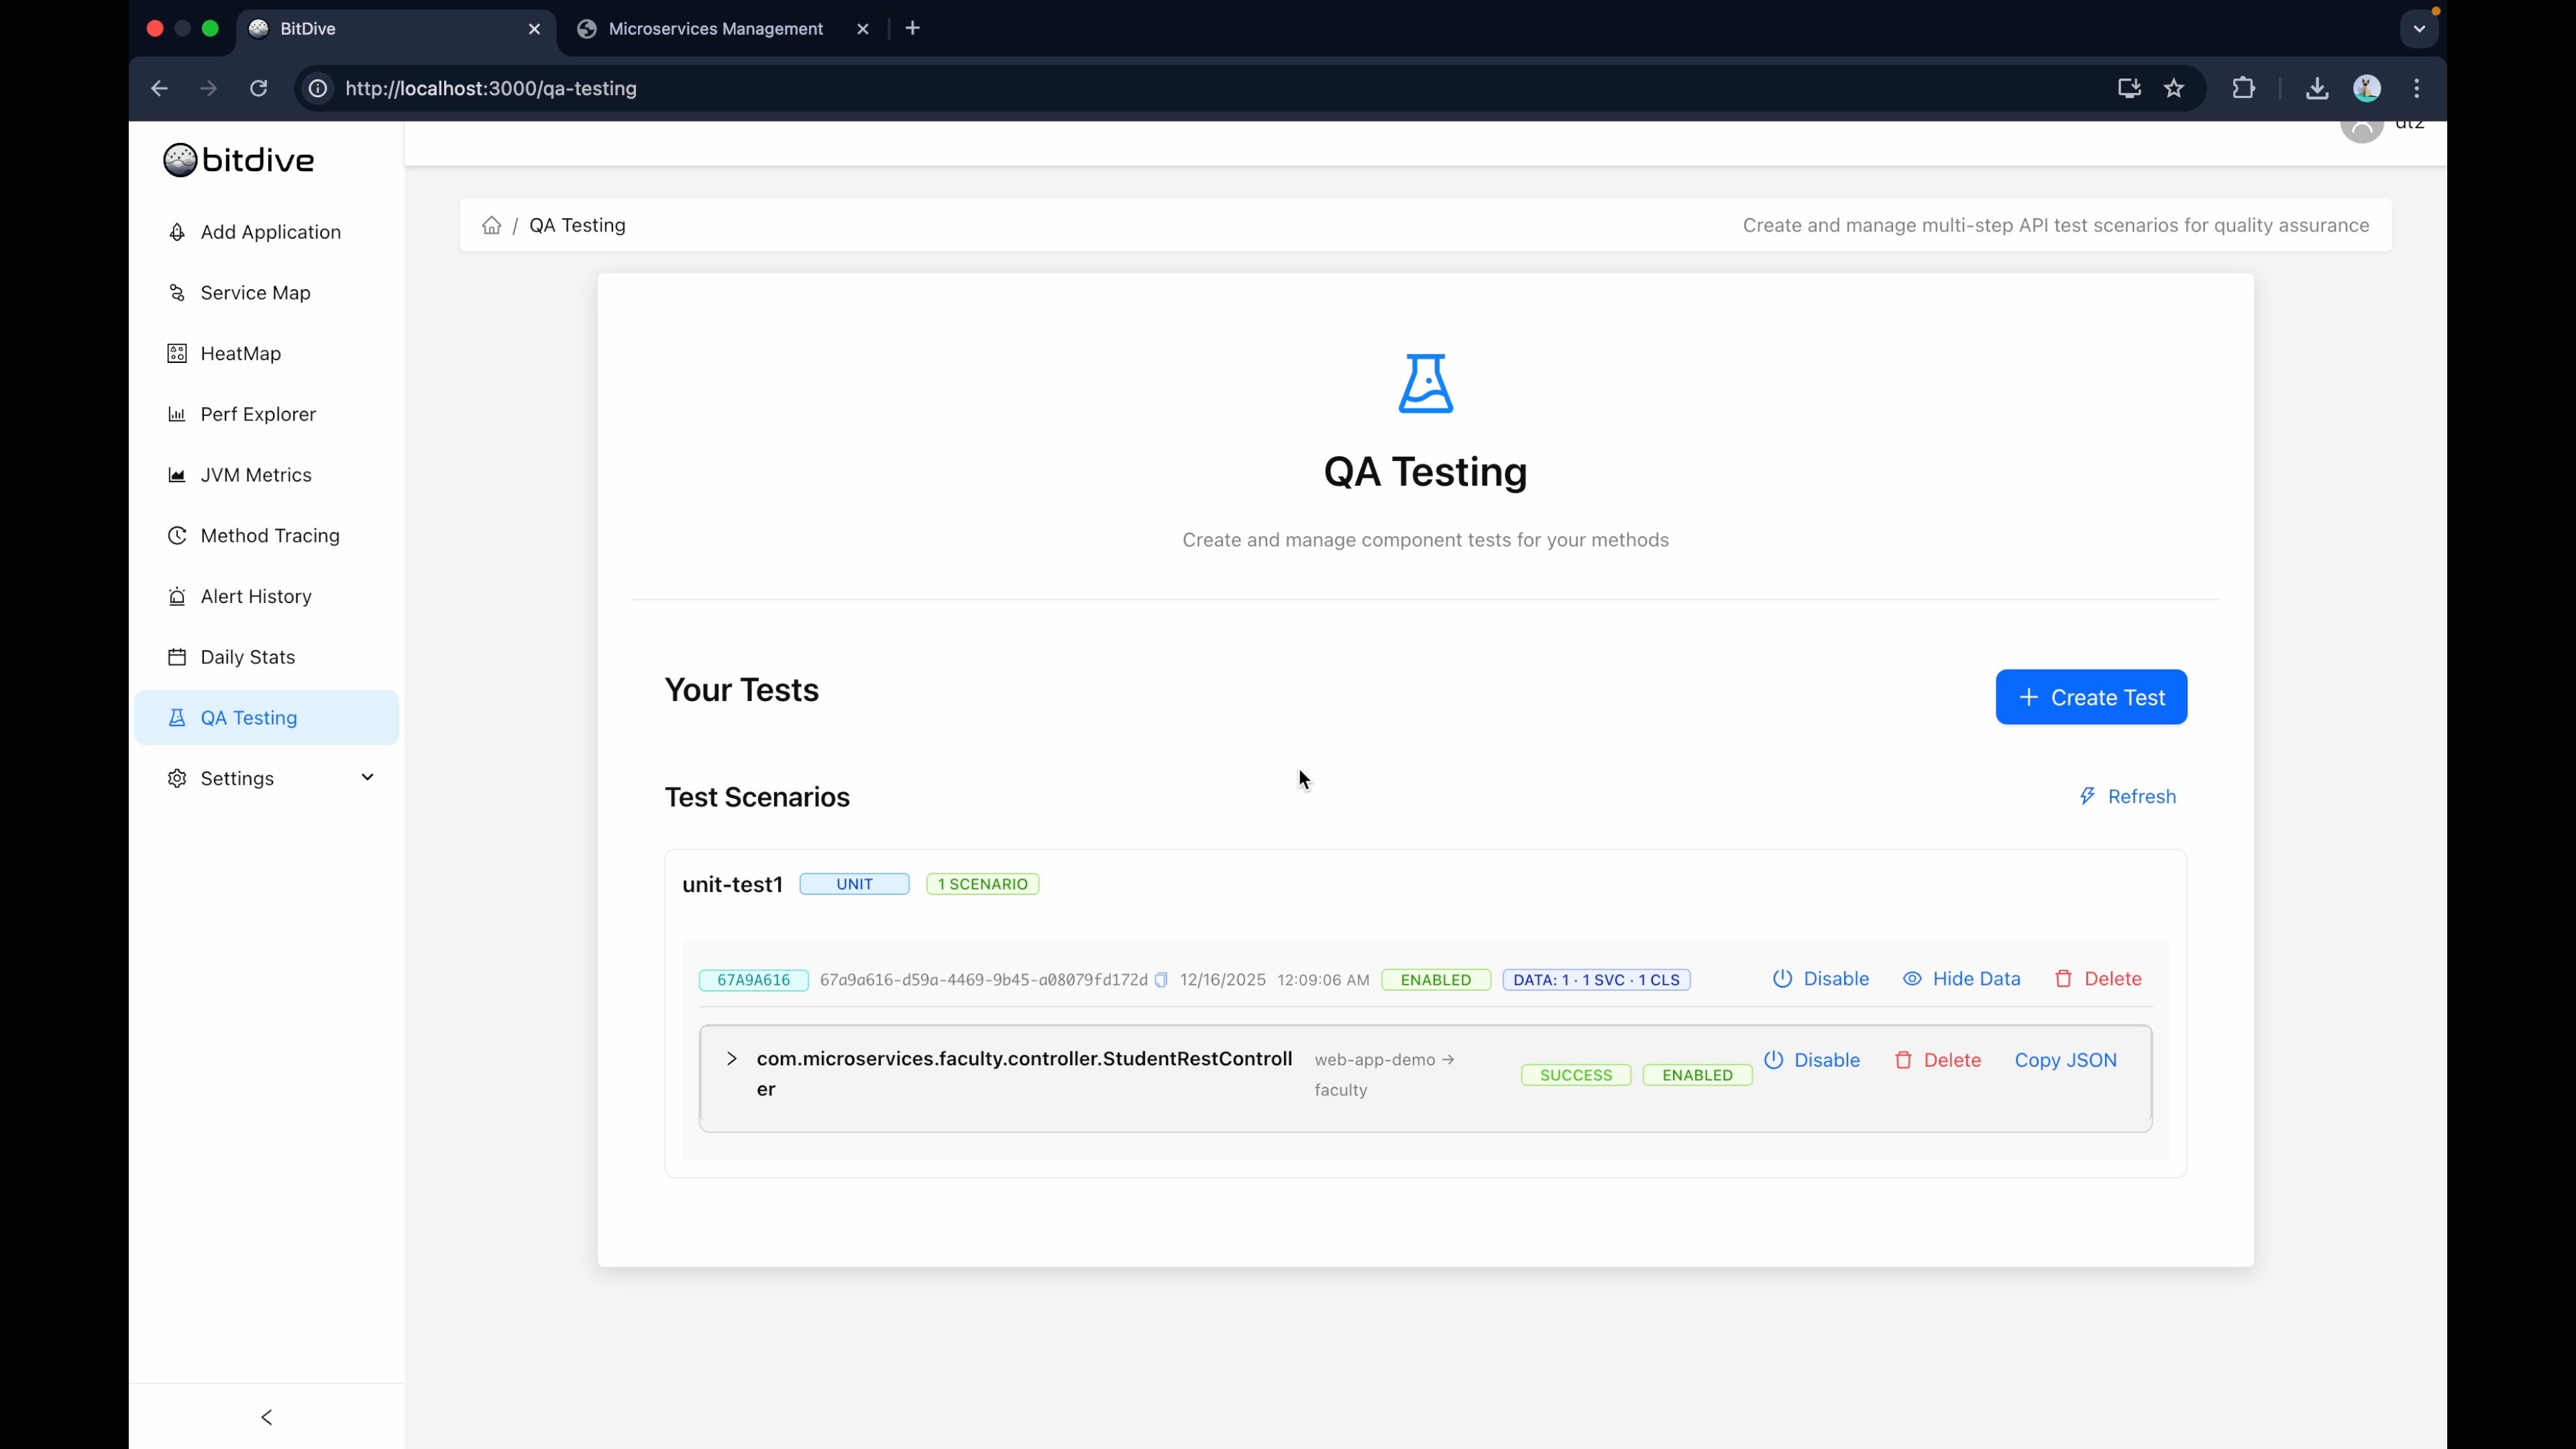
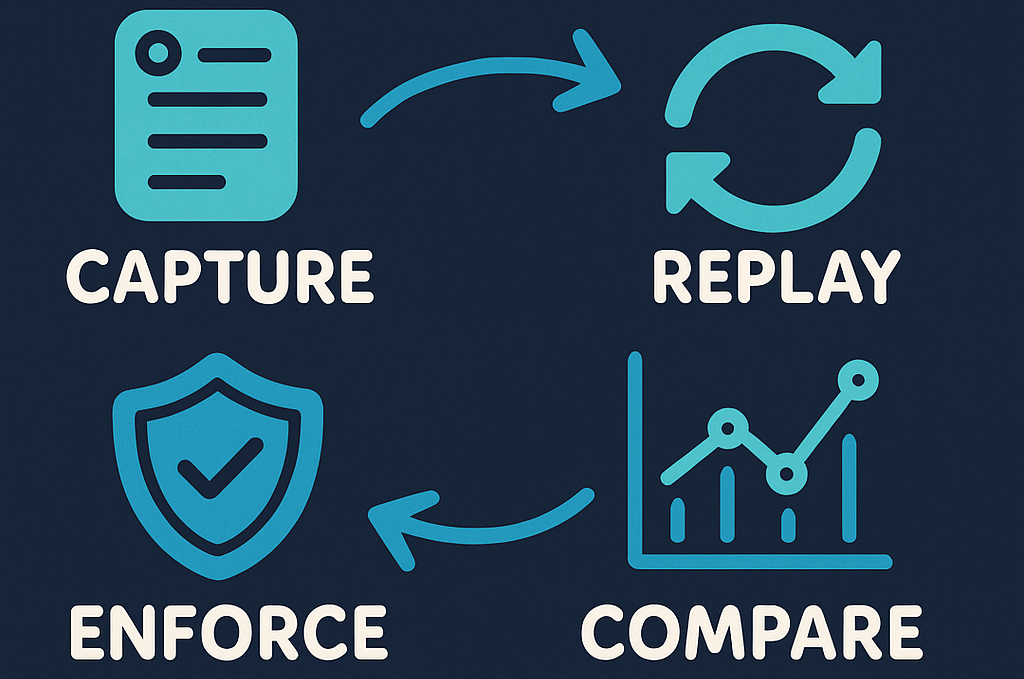
BitDive provides a single platform for the entire testing lifecycle. It captures real execution data, curates meaningful scenarios, replays them across builds, and validates results where it matters most-at the level of API responses, database queries, and messaging flows.

JVM-first • Testcontainers-ready • Kafka/gRPC/JDBC support • CI/CD friendly • Flake-resistant

BitDive SaaS Is Live - Try It Free Today

· 3 min read
Artem Vavilov
Strategic Product Leader | Driving Innovation in Software Solutions

BitDive SaaS Is Live

We're excited to announce the launch of BitDive SaaS - our fully hosted, cloud-based observability platform built for modern Java microservices. This launch marks a major milestone in making deep performance tracing and real-time insight available to everyone, instantly and effortlessly.

Now, instead of setting up infrastructure or maintaining backend components, developers can get started in just minutes. The BitDive agent connects your application to our platform, and you're immediately able to trace distributed requests, profile methods, visualize service dependencies, and capture runtime data - all in a single place.

BitDive MCP Server brings full runtime context to development

· 3 min read
Artem Vavilov
Strategic Product Leader | Driving Innovation in Software Solutions

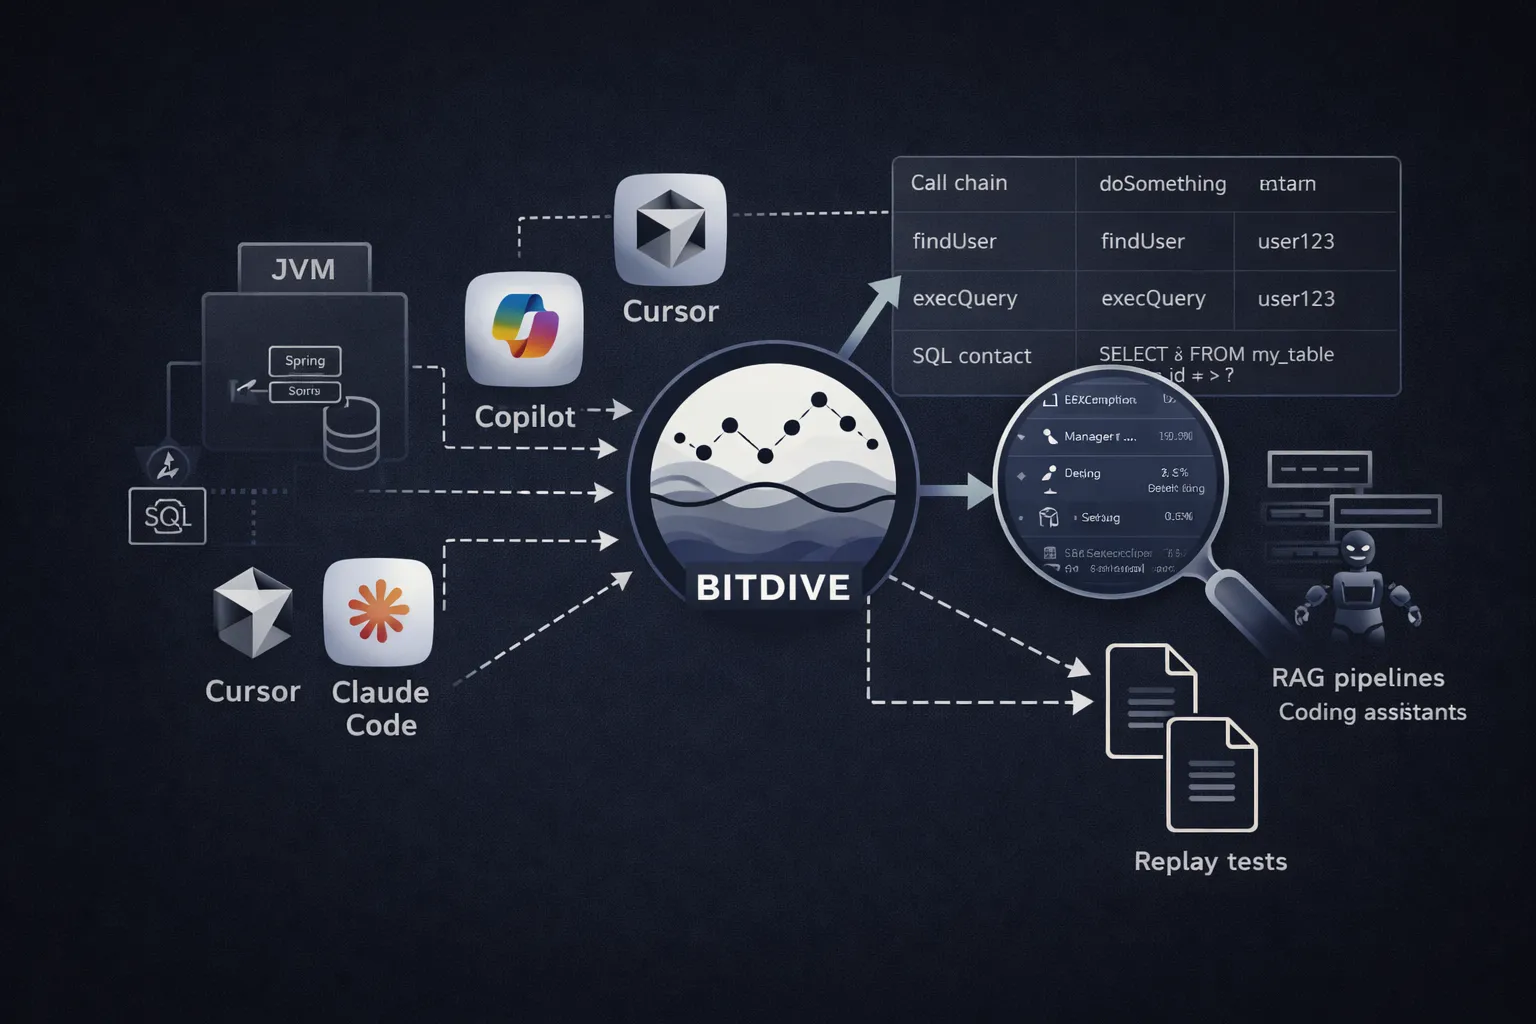
Yesterday, we announced the MCP Server (Model Context Protocol) integration for BitDive. This new capability allows you to access full runtime context for any method executed in production — including input parameters, return values, exceptions, SQL queries, and downstream calls. MCP turns observability into a daily development tool, not just a monitoring system.

Application Monitoring - Keep Your Finger on the Pulse of Your Systems

· 3 min read
Evgenii Frolikov
Senior Java Engineer | Expert in Scalable Enterprise Solutions

Application Monitoring

Modern applications are increasingly becoming business-critical. Unstable performance, prolonged downtime, or a lack of visibility into what's happening inside the system can lead to significant financial losses and reputational damage. Meanwhile, traditional logging-based methods of monitoring often fall short: logs may be insufficient, or they get lost in a massive stream of messages.

Automatic Exception Logging - A Key to Proactive Application Monitoring

· 4 min read
Artem Vavilov
Strategic Product Leader | Driving Innovation in Software Solutions

Automatic Exception Logging

The Challenge of Debugging Distributed Applications​

Distributed systems have become the backbone of modern software architecture. But with this complexity comes the challenge of tracking down errors and understanding their impact across multiple services. Relying solely on logs or traditional error-tracking tools often leaves developers frustrated, chasing incomplete information.

That's why BitDive introduces a game-changing solution that combines error interception, distributed tracing, correlation IDs, metrics, and alerts—delivering developers a complete observability toolkit for debugging distributed applications with ease and precision.