eBPF vs. BitDive: Why AI Agents Need Runtime Context, Not Just Kernel Syscalls

TL;DR: eBPF is great for monitoring kernels, but it’s blind to business logic. For AI agents to effectively fix code, they need Real Runtime Data context: classes, methods, and parameters. BitDive delivers the exact Runtime Context that AI models (and humans) need to solve real application problems.
eBPF vs BitDive: Why AI Agents Need Runtime Context
Why do we need production profiling at all?
Application performance isn't abstract. It's about real issues: errors, timeouts, lost users, and wasted money. But to understand what exactly is slow, it's not enough to know that "CPU is high." You need detail: which service, which method, which request, which parameters — the kind of code-level observability that only application-level instrumentation can provide.
This is where two approaches come in:
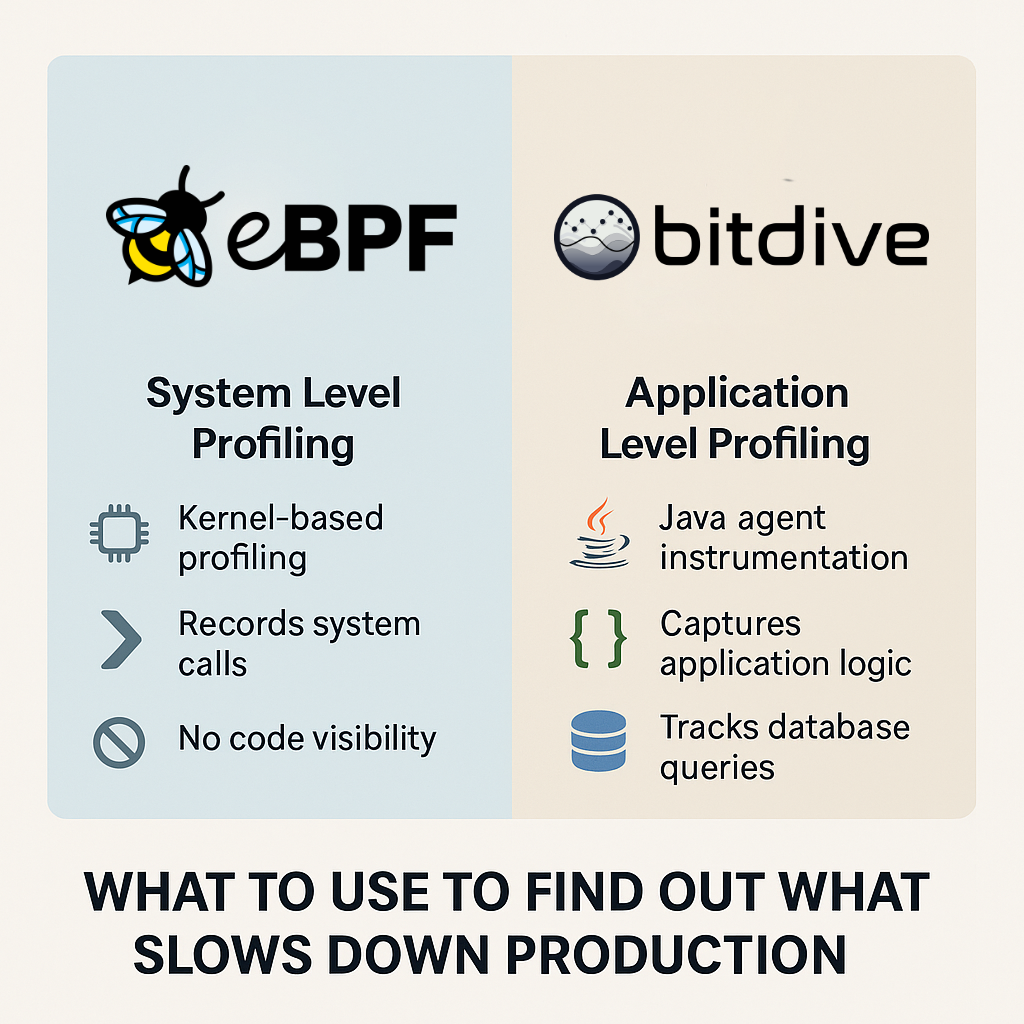
- eBPF - ultra-lightweight, kernel-oriented profiling
- BitDive - a Java agent embedded in the application, focused on business logic
Although eBPF and BitDive operate on different levels - system and application - they both aim to answer the same question: why is production slow?
Choosing the right tool depends on whether you need a high-level system view (eBPF) or deep insight into what's happening in your code (BitDive).
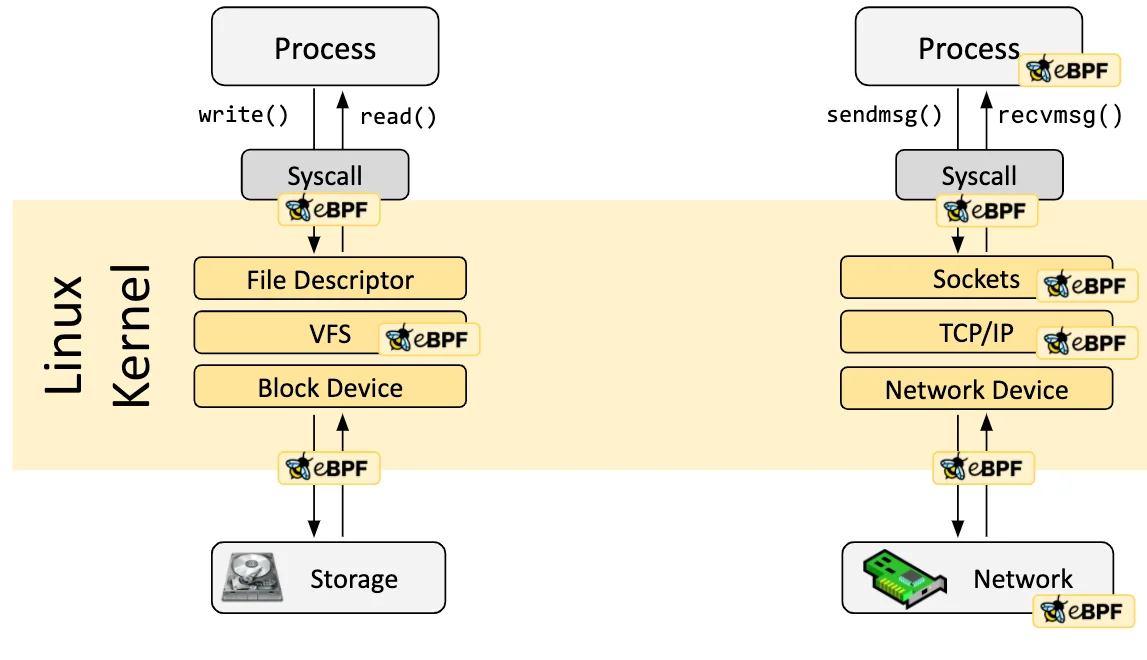
eBPF runs at the Linux kernel level and hooks into syscalls, sockets, filesystems, and network events. But it doesn't see what your code actually does inside.
The problems with eBPF they don't mention in brochures
Requires root access
To run an eBPF agent, you need kernel-level access:
- Root, or capabilities like
CAP_BPF,CAP_PERFMON,CAP_SYS_ADMIN - In cloud environments, this means: negotiating with DevOps/SRE, setting up IAM, running execs into nodes, deploying DaemonSets
- Developers can't just run this themselves in 99% of real-world cases (unless it's a 4-person startup)
Host-bound visibility
If your app is spread across multiple VMs or nodes:
- eBPF can't see beyond the current kernel
- You have to install agents on every node and aggregate data manually
- This is complex and requires ops support
Lack of application-level context
eBPF doesn't understand application structure:
- No method names, class names, or package names
- No input parameters
- No exceptions or return values
It operates on low-level syscalls like malloc, pthread_create, read, etc., and can't map those to your actual business logic.
Find Bottlenecks Faster with BitDive
See exactly which methods are slowing down your application with method-level profiling that doesn't require root access. Get started in minutes, not days.
Try BitDive TodayNoisy by default
With 100+ containers running in prod, eBPF sees everything:
- One container may host multiple processes
- One process may have multiple logical layers
Without grouping and filtering, this data quickly becomes a useless dump.
Raw data, low insight
- eBPF tools (Parca, Phlare, Elastic) don't surface errors, slowdowns, or service-to-service relationships
- You have to build everything manually from flame graphs and stack traces
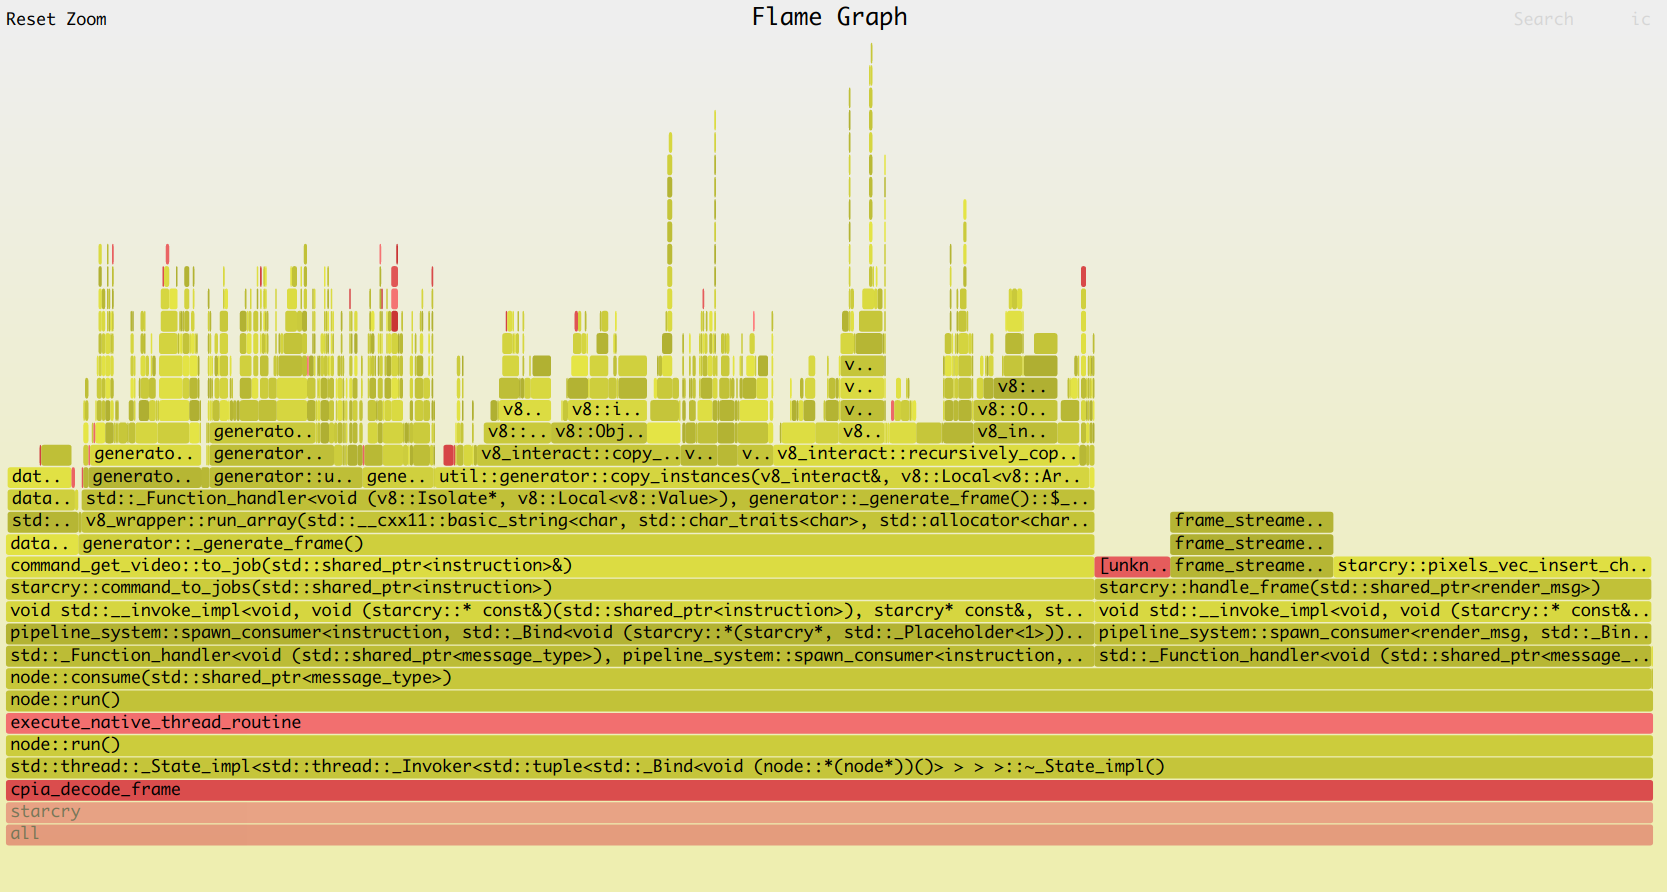
Example of a flame graph obtained using eBPF, demonstrating how call stacks are displayed without business logic context.
What about distributed systems?
eBPF has serious limitations in modern, distributed environments:
- It doesn't see traces or spans - so it can't tell that Method A was part of a user request chain
- It can't transmit data across nodes - every agent is isolated
- It can't link events between containers or processes across cgroups or namespaces
- There's no concept of the "request as a whole" - only CPU fragments
So you might see that encrypt() spiked CPU on node 1, but not know it was step 3 in a request from frontend to billing.
What BitDive brings
Method-level context
BitDive is embedded in the JVM and understands the code structure. It shows:
- Method, class, package, framework
- Who called the method and under what context
- Which parameters were passed
- What downstream requests (SQL, Redis, Kafka) were triggered
Errors, exceptions, anomalies
BitDive automatically highlights:
- Methods with high execution time (e.g. >1s)
- Exceptions that occurred in methods
- Spikes and anomalies in timing
No root access needed
BitDive is just a library:
- Add the agent to your
pom.xmlor Gradle config - Provide a small config file
- Start your app - profiling is active
No kernel tuning, no root rights, no DevOps dependency.
Distributed chains, explained
BitDive traces how a user request flows through your stack - from frontend to deep backend - connecting service calls and API interactions.
Unlike traditional distributed tracing (which stops at spans), BitDive dives into the internals:
- Shows exact methods, parameters, exceptions
- Highlights slowdowns deep inside logic
- Links downstream dependencies in real-time
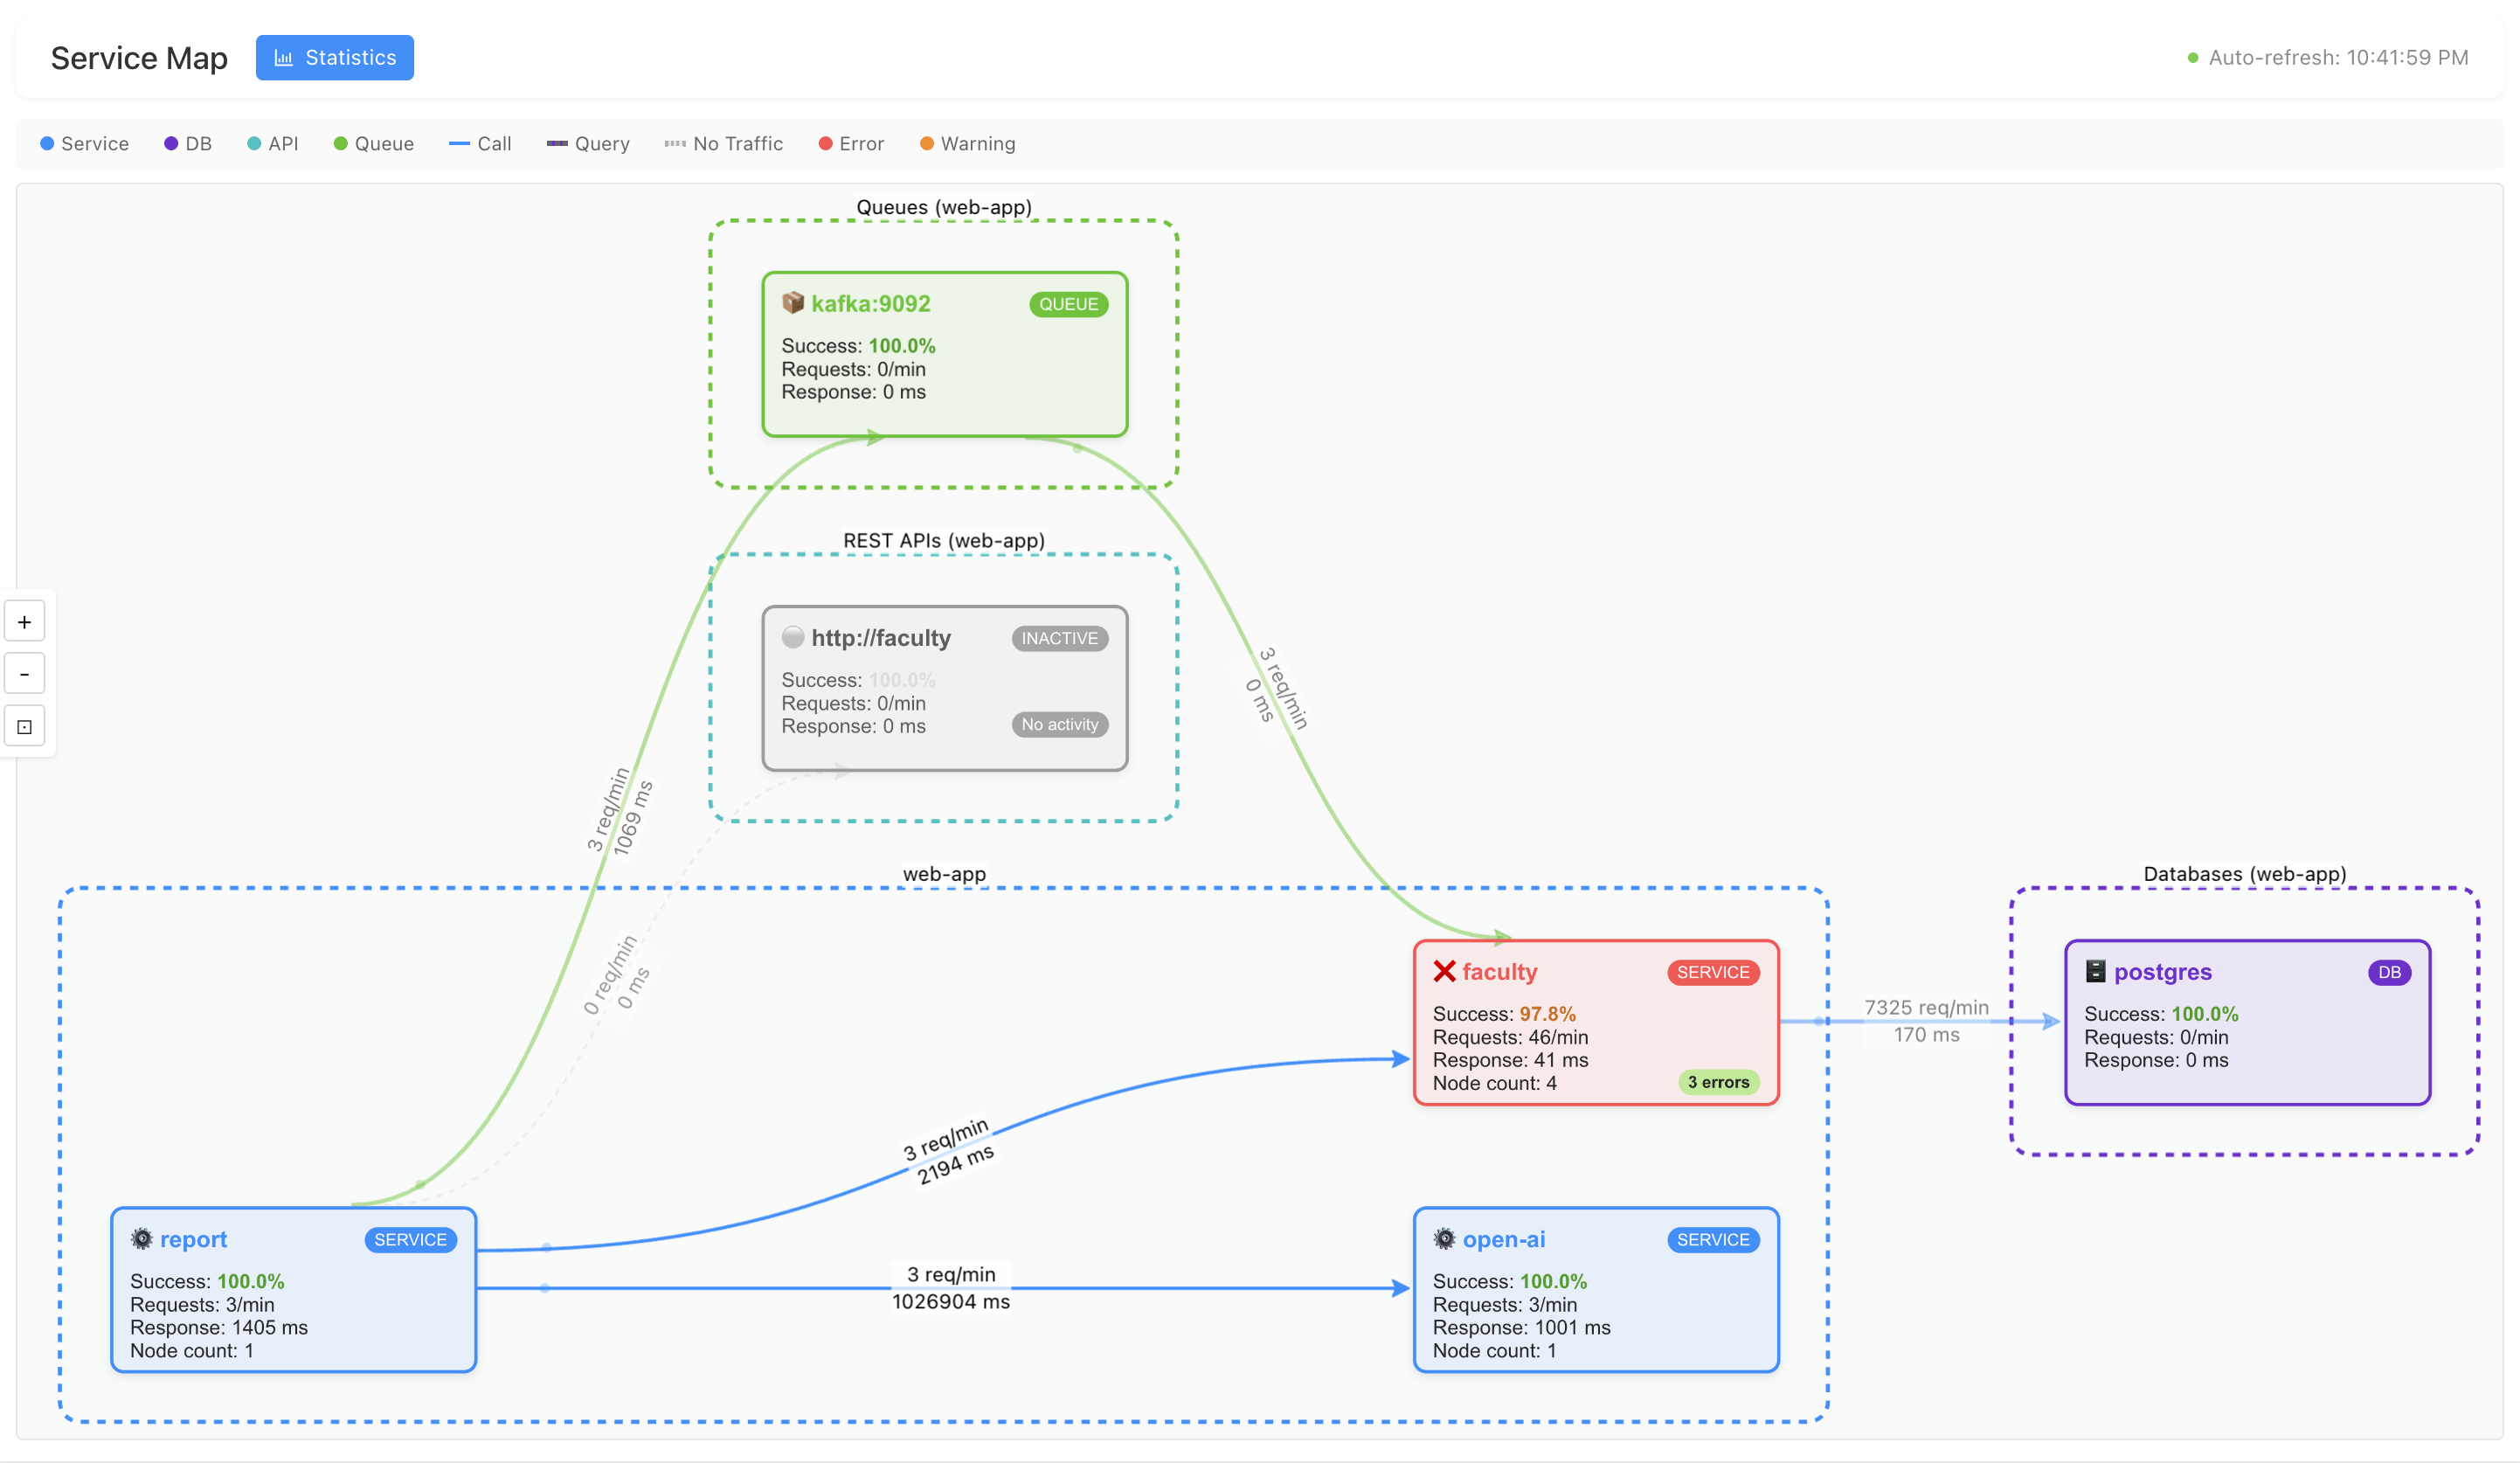
Example of a service map in BitDive: connections between components are visible, including a Kafka queue, errors in one of the services (
faculty), and delays at each step. Such visualizations allow you to quickly locate where degradation is occurring in a distributed system.
In short: you get profiling within the request context, not just generic time samples. This is what we call debugging with full execution context.
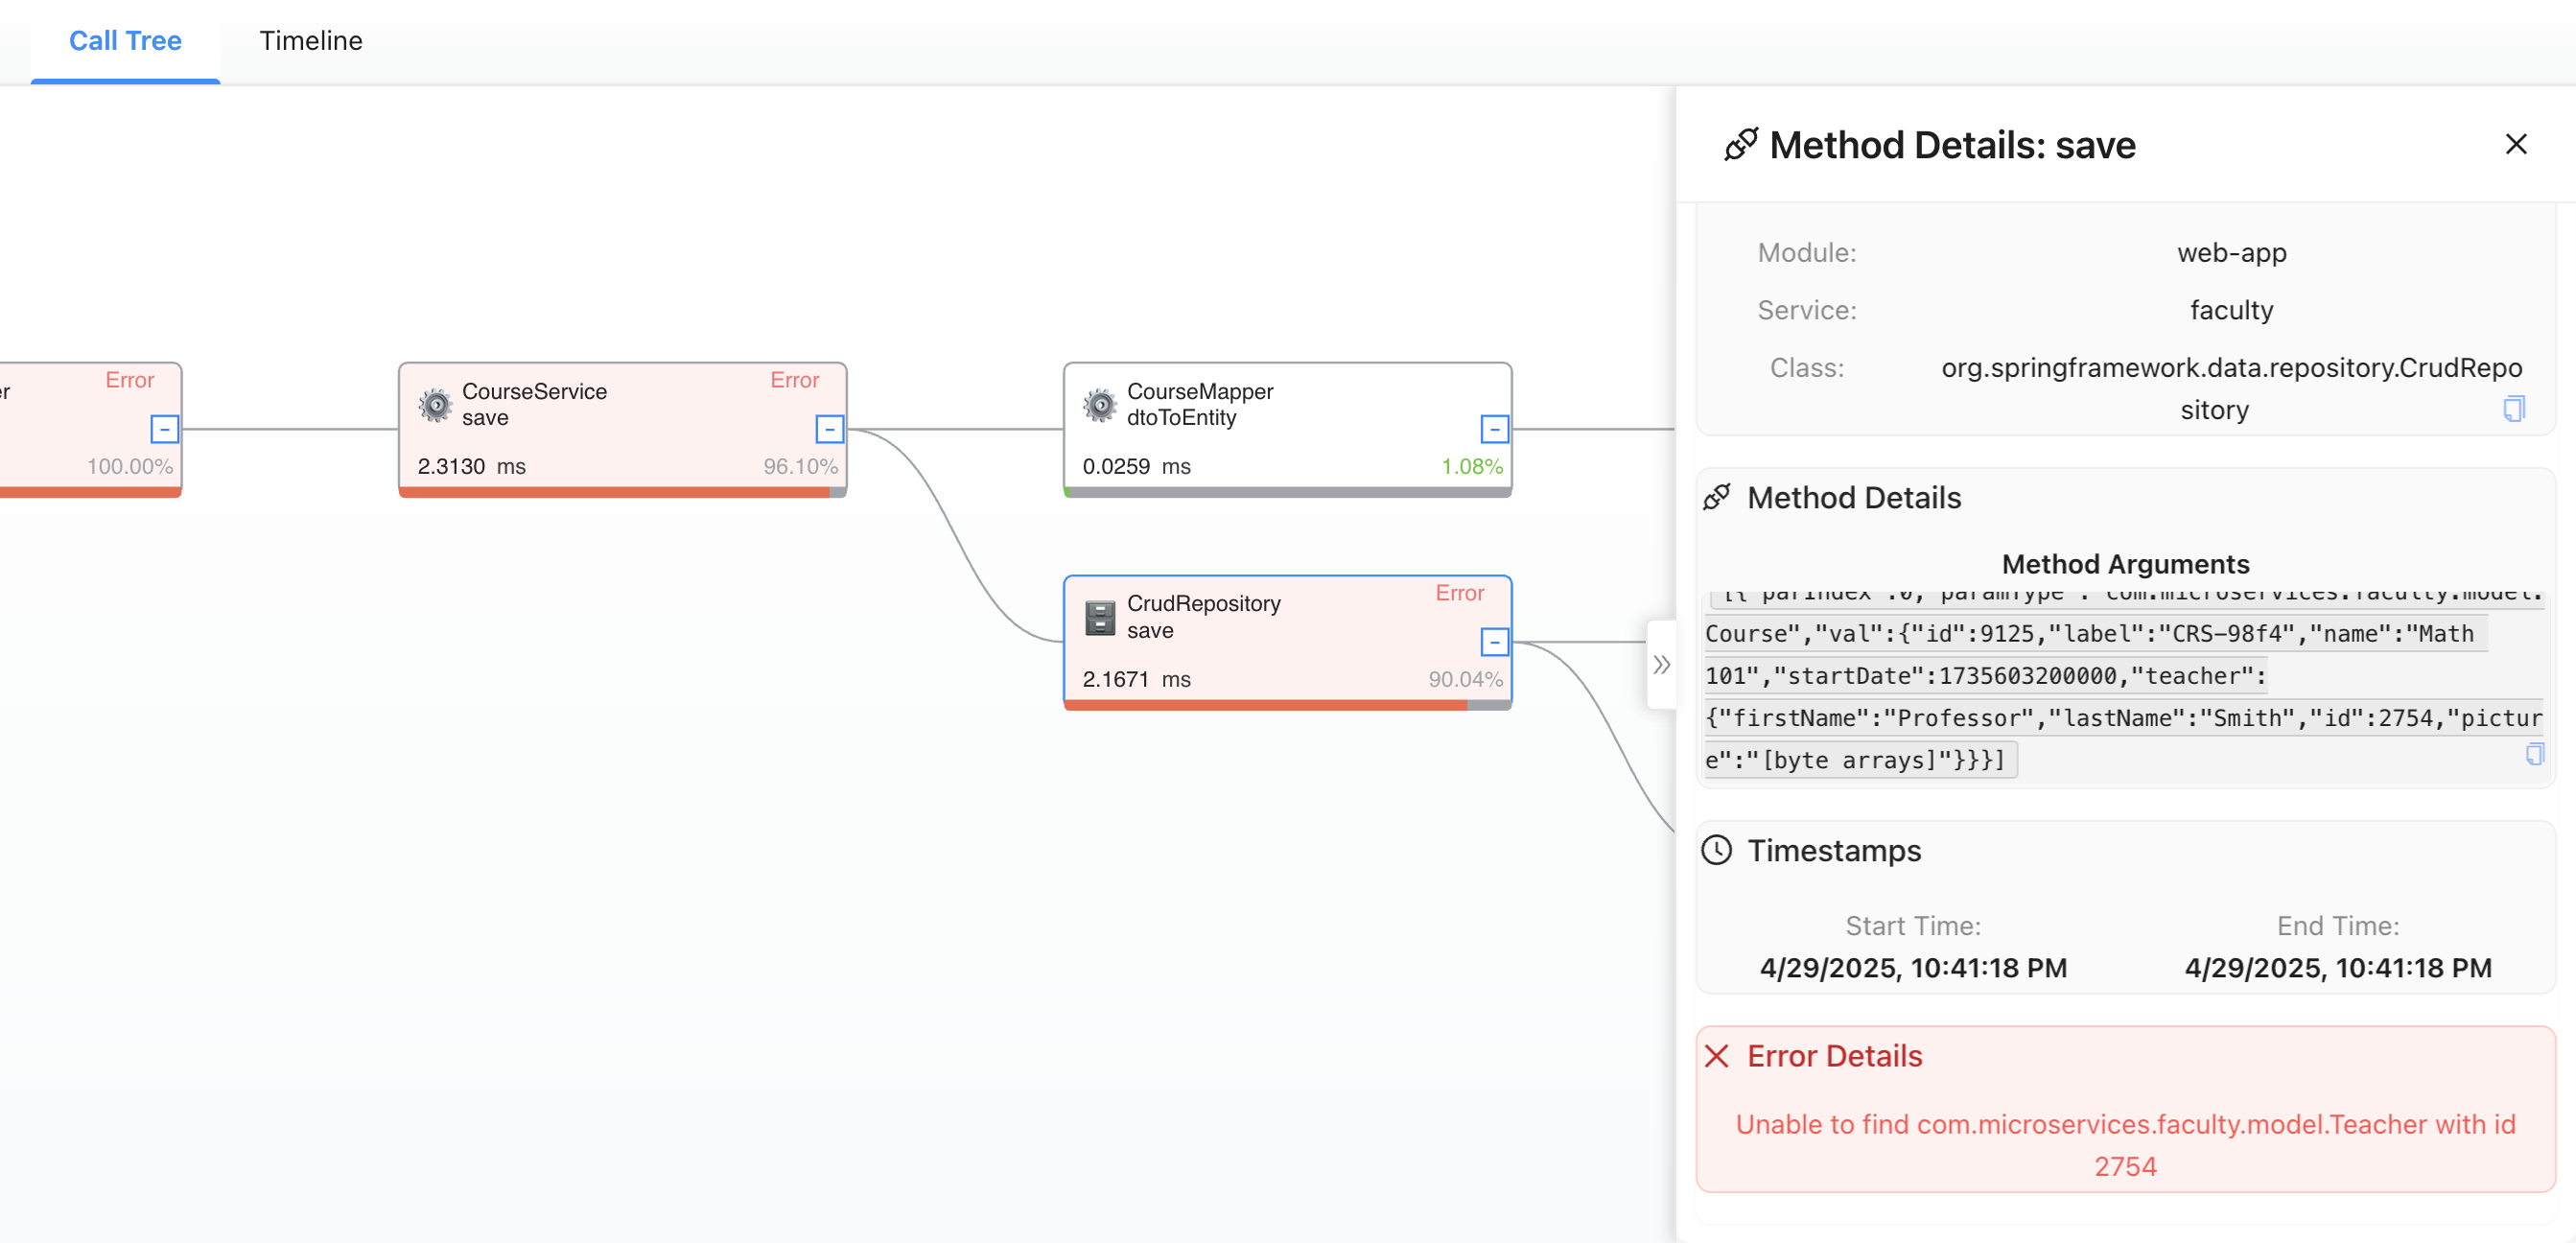
Fragment of a call in BitDive with an error inside the
savemethod. You can see what arguments were passed, what specific error occurred (error looking up aTeacherobject with id 2754), and at which layer it happened. This level of detail helps understand the cause of problems - not just see that something went wrong.
Full comparison: eBPF vs BitDive
| Category | eBPF | BitDive |
|---|---|---|
| Level | Kernel, system calls | Application, methods |
| Requires root | ✅ Yes | ❌ No |
| Cloud installation | ❌ Complex (IAM, DaemonSet) | ✅ Easy: Java dependency |
| Multi-host support | ❌ Needs infra coordination | ✅ Built-in (via app-level logic) |
| Stack depth | libc / native funcs | Methods, classes, packages |
| Business logic awareness | ❌ None | ✅ Full |
| Errors / exceptions | ❌ Not visible | ✅ Yes |
| Method parameters | ❌ No | ✅ Yes |
| SQL/HTTP/Redis visibility | ❌ Low-level only | ✅ Full context |
| Flame Graph | ✅ Raw only | ✅ Grouped + contextual |
| Interface | CLI / basic UI | UI for developers |
| Language support | Any (no context) | Java (Spring, Micronaut, Quarkus, etc.) |
| Distributed tracing | ❌ Not supported | ✅ Yes (code-level chaining) |
| AI Utility | ❌ Minimal (Syscalls only) | ✅ High (Runtime Context) |
The AI Advantage: Why AI Agents Prefer BitDive Over eBPF
In 2026, the primary user of observability data is often an AI agent like Cursor, Windsurf, or a custom LLM pipeline.
eBPF gives AI "noise": An LLM cannot fix a NullPointerException or an N+1 query problem by looking at low-level read() or write() syscalls.
BitDive gives AI "Actionable Code Context": Via the MCP Server, BitDive provides the AI with:
- The exact Method Name and File Path.
- The specific Input Parameters that caused the error.
- The SQL Statements triggered by that method.
This is the Runtime Context that allows an AI agent to propose a surgery-precise fix and verify it with a Trace Replay test.
When should you use BitDive?
Use BitDive when:
- You run Java (monolith or microservices)
- You want to know which method is slow, why, and with what params
- Errors, retries, SQL calls, and real root causes matter
- You don't have root access in production
- You want developers - not just DevOps - to have profiling power
- You're working with service-to-service calls and need request-level insight
Conclusion
eBPF is a powerful kernel-level tool. It's irreplaceable for profiling Go, C++, and system internals.
But it lacks context - especially for Java teams who need to:
- Understand slow code paths
- Find logic-level errors
- Trace request chains inside applications
- Operate without root or low-level system hooks
BitDive is an application-level profiler built for real-world Java stacks. Where eBPF stops, BitDive starts.
Market Landscape & Comparisons
If you are evaluating other recording/replay tools that use network-level capture or eBPF proxies, check out our detailed guides:
Learn more about Performance Metrics Guide. Explore Application Performance Optimization. See how BitDive helps with Application Monitoring. Check the BitDive Glossary for technical terms.