How AI Agents Ship Safe Code with BitDive
Before writing code, agents see real runtime data. After changing code, they compare execution traces to prove correctness.
See Real Data Before Writing Code
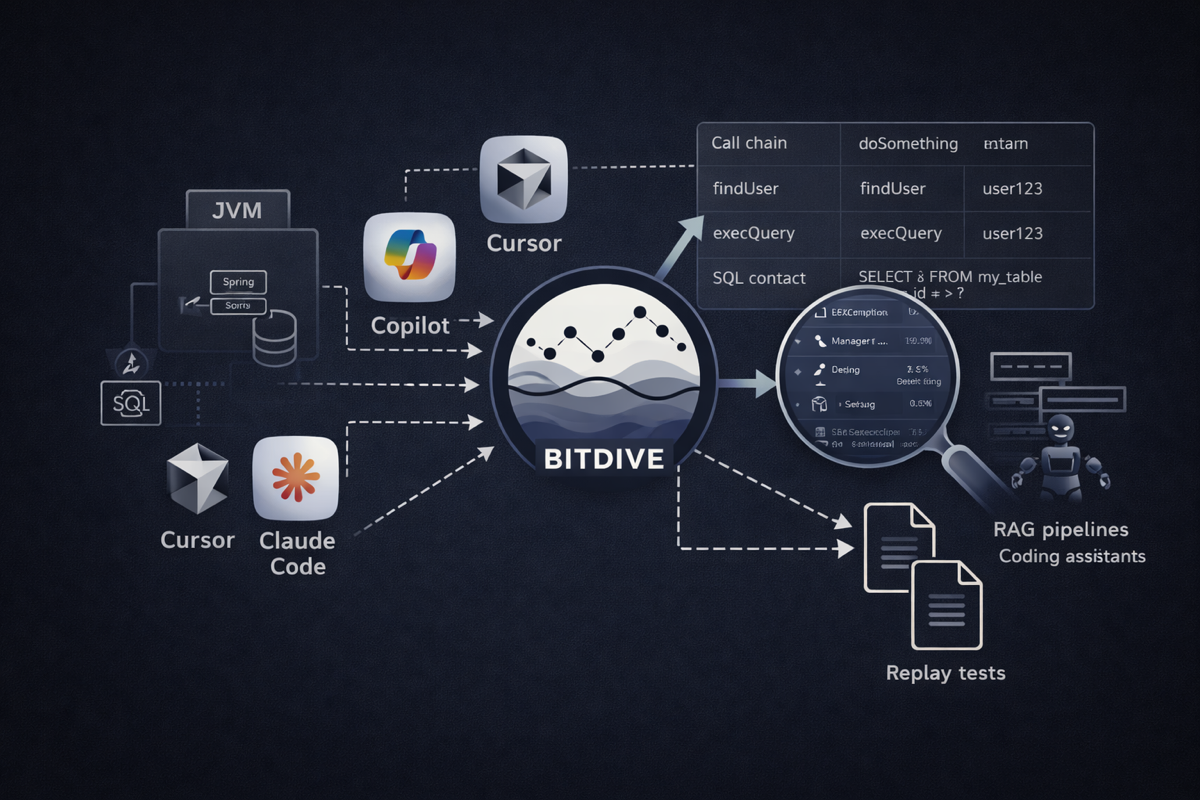
The agent fetches a full execution trace via MCP: real payloads, SQL queries, and call hierarchy. No guessing from source code alone.
Create JUnit Tests from Real Traces
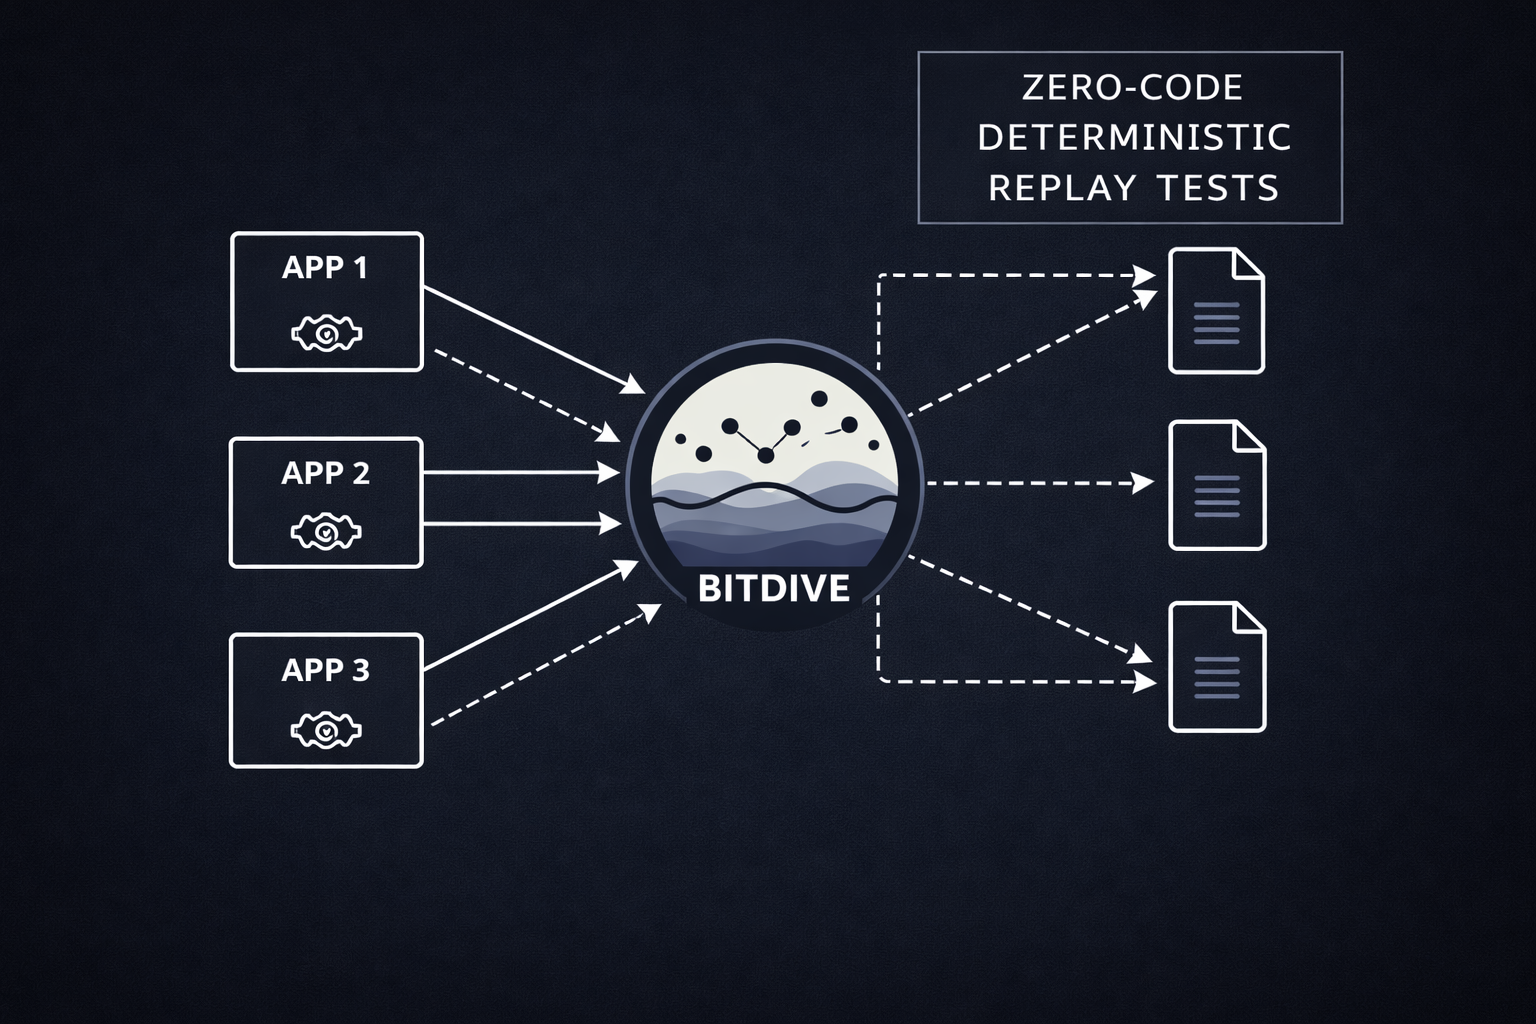
Select an execution trace, click create. BitDive produces a deterministic JUnit test with auto-mocked dependencies. Works on the first run. No Mockito scripts to maintain.
Compare Before vs. After Execution
After a code change, the agent captures a new trace and compares it to the original. Identical where expected, changed only where intended.
Method-Level Visibility Across Your Entire Stack
See every method call, SQL query, and service interaction with exact parameters and return values.

Scale Your Test Coverage, Not Your Codebase
Stop writing test code to test code.
Build a regression shield that runs anywhere. BitDive isolates services virtually, allowing you to verify logic without spinning up complex staging infrastructure.
- Dependency Virtualization: Test services in total isolation. BitDive virtually replaces downstream calls (DBs, Kafka, APIs).
- Infrastructure-Free Execution: Run integration-level scenarios on a laptop or ephemeral CI agent.
- Eliminate Flakiness & Tech Debt: No fragile scripts or manual mocks. Test against captured deterministic behavior.
From Runtime Capture to Verified Code Change
Three stages that close the loop between real production behavior and every code change.
Capture: Real Runtime Traces
No code changes needed. Works with any Java/Kotlin service.
BitDive runs alongside your service, capturing complete execution context: every method call, every SQL query, every API response. No code changes needed.
- Method calls with exact parameters and return values
- SQL queries with actual parameters and result sets
- HTTP requests, Kafka messages, and cross-service traces
Create: JUnit Tests from Traces
One click. Deterministic, isolated, runnable.
Select any captured trace and create a standard JUnit test. BitDive auto-mocks databases, APIs, and message queues. No Mockito scripts to maintain.
- Mocks built automatically from real captured responses
- Runs locally or in CI with zero external dependencies
- Standard JUnit 5. Works with mvn test, IntelliJ, any CI.
Verify: Before vs. After Trace Comparison
The agent proves its own code change is correct
After modifying code, capture a new trace and compare it to the original. See exactly what changed and confirm nothing broke unintentionally.
- Side-by-side comparison of SQL patterns and results
- Method-by-method diff of inputs and outputs
- Unchanged methods confirmed identical (semantic match)

The Autonomous Quality Loop
AI agents that investigate, fix, and prove correctness automatically
Connect Cursor, Claude, or Windsurf to BitDive via MCP. Your agent sees real runtime data before writing code, then verifies its own changes by comparing execution traces.
- Runtime Context First: Before writing a fix, the agent fetches the actual execution trace: real payloads, SQL queries, call hierarchy. It understands how data really flows, not how it imagines it from source code.
- Dual-Trace Verification: After the fix, the agent captures a new trace and compares it to the original. Unchanged methods stay identical. Changed methods show exactly what shifted. The diff is the proof
- Full Regression Close-Out: The agent runs
mvn testto confirm nothing else broke. If tests fail, it fetches the failing traces from BitDive, understands the regression, and either fixes or rolls back
Why Teams Switch to BitDive
From fragile mock scripts to tests grounded in real execution data
Refactor legacy Java systems fearlessly. Your regression safety net is built from real runtime traces.
Start creating test suites immediately. 2-minute setup, no months-long integration projects.
Give AI agents real runtime context so they stop guessing and start verifying their own code changes
Dependencies auto-mocked from captured data. Stop writing and maintaining Mockito scripts
Time to convert user flows into hundreds of runnable JUnit tests
See exact method inputs, SQL queries, and return values. No more black-box debugging
Stop Coding Mocks. Start Capturing Logic.
Eliminate fragile test scripts. Turn production behavior into deterministic JUnit tests today.